Part
01
of three
Part
01
Voter Participation
The voter participation of 18-29 years old in the 2020 presidential elections is estimated to be much higher than the last elections. As per US Census Bureau data, while the voting rate of the young people has overall declined since 1968, their voting participation has increased since the year 2000. The US Census Bureau or the US Election Project website has not yet updated the final voting rate data for the 2020 elections. Hence, we have provided the estimates available for the same. By aggregating data from the various official sources, we have presented below a detailed overview of how voter participation across various age groups has varied in US presidential elections over time.
US Voter Participation By Age Over Time
- As per estimates from the CIRCLE research center at Tufts University, the turnout rate of young voters increased in the 2020 US presidential elections and was much higher as compared to the 2016 elections. According to CIRCLE's estimates based on votes counted as of November 18, nearly 52%-55% of voting-eligible young people, aged 18-29 years, cast a ballot in the 2020 election as compared to estimates of 42-44% in 2016.
- Further, CIRCLE expects the final percentage of youth turnout in the 2020 presidential elections (once the numbers are finalized) to rise to around 53%-56% as compared to 45%-48% estimated in 2016. Additionally, the youth vote also had more weight overall in 2020. The electorate share of people aged 18-29 years is expected to be around 17% in 2020 as compared to 16% in 2016.
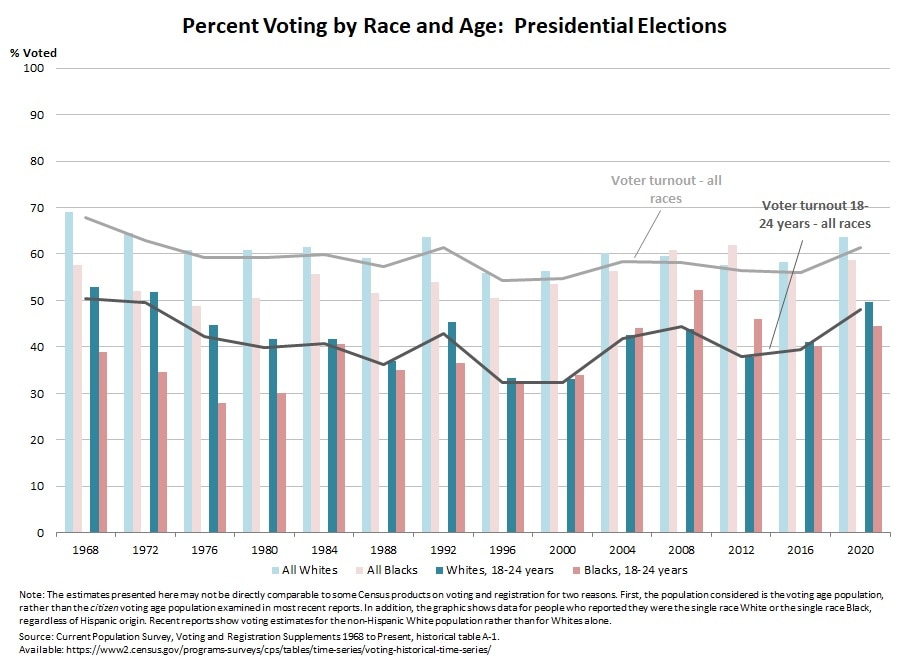
- The US Census Bureau provides historical voter turnout data for people aged 18-24 years in various presidential elections from 1968 to 2016. The final numbers for the 2020 election have not yet been updated. The above graph depicts these numbers in greater detail. The underlying data can be viewed here.
- As per the US Census Bureau data for voting participation in various presidential elections, the voting rate for people aged 18-24 years has declined from 50.4% in 1968 to 39.4% in 2016. However, since 2000, their voting rate increased from 32.3% to 39.4% in 2016. The same is also true for the 25-44 years age group. Their voting participation went down from 66.6% in 1968 to 49% in 2016. However, since 2000, their voting rate has remained stable (49.8% in 2000 to 49% in 2016).
- For those aged 45 to 64 years, the voting rate went down from 74.9% in 1968 to 61.7% in 2016. This age group has seen a constant decline in their voting participation. Since 2000, the voting rate for this age group has declined from 64.1% to 61.7%. On the other hand, the 65+ age group is the only one to have witnessed a surge in their voting participation since 1968. The voting rate of this group in the US presidential elections has increased from 65.8% in 1968 to 68.4% in 2016. For most of the primary elections, their voting rate has remained in the high 60s and has stabilized in the 67%-69% range since 2000.
- Overall, since 1964, voter turnout rates in U.S. presidential elections have generally decreased across all age groups, except for those over the age of 65. From 1988 onwards, voter participation has increased with age across the various age brackets. This is primarily because people are more likely to vote as they become old. Participation "among eligible voters under the age of 25 is the lowest of all age groups, and in the 1996 and 2000 elections, fewer than one-third (33%) of eligible voters under the age of 25 participated, compared with more than two-thirds (66%) of voters over 65 years."
- An interactive graph of the voter turnout rates among selected age groups in US presidential elections from 1964 to 2016 can be viewed on Statista. A snapshot of the same can be accessed here.
- The US Election Project website provides detailed historical data on the overall voter turnout rates in primary and mid-term elections for different age groups based on Census Bureau's Current Population Survey. This data is reported after adjusting it for sampling and no-response errors. The detailed time-series data can be accessed from the 'Age' tab of the provided spreadsheet. However, the age groups reported in the same vary slightly (18-29 years instead of 18-24 years). The below two graphs represent the voting rates data and trends by age group as provided by the US Census Bureau.


