Part
01
of one
Part
01
VC Startup Investments Since 1970
Key findings
- The figures overall show that there appears to have been an increase in venture capital startup investments over the decades.
- There were no venture funds raised in 1975.
- Estimates are given for the decades 1970 – 1980, 1980 to 1990 and 1990 to 2000.
Introduction
As no geographic focus was provided the research team looked for figures showing the total amount of venture capital (VC) investment over the five decades since 1970 at a global level. Figures were found for the most recent decade reported by the OECD which show VC investment by country split into seed, start-up and early investment and later-stage venture. The data gives figures from 2002 to 2020 covering nearly all the last two decades. However, the data from that source is limited for 2002 to 2006. The data was extracted to a google sheet for ease of reading and a link to this has been provided. A report by a Harvard Business School professor allowed estimates to be given for three of the other decades and a report from Statista provided figures for the last one. Details are given below.
VC startup investments
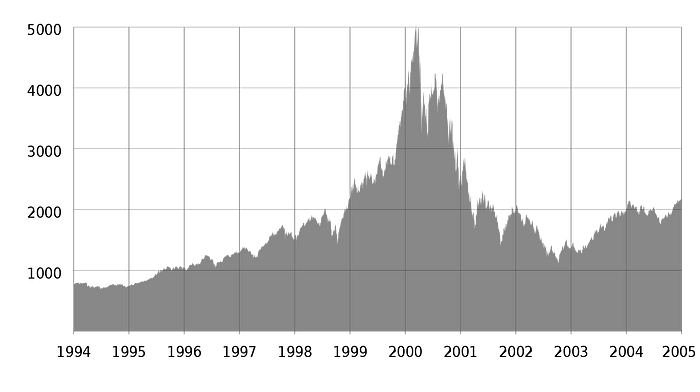
- Chart 2 in the report called the Boom and Bust in the Venture Capital Industry shows venture capital fundraising by year from 1969 to 2001 in the USA. Using this an estimate for the decade 1970 to 1980 would be between US$1.1 and US$2 billion. It notes that there were no venture funds raised in 1975.
- Using the same chart an estimate for the decade 1980 to 1990 would be between US$10 and US$ 20 billion.
- Again using the same chart for the decade 1990 to 2000 an estimate of the venture capital investment during that period would be between US$40 and US$60 billion.
- The image below shows how there was a spike in investments when the internet entered the frame into the decade 2000 – 2010.
- Statista gives the value of venture capital activity globally from 2010 to 2019 as US$ 337 billion.
- Total venture capital investment from 2010 to 2020 based on figures from the OECD US$ 1,753,166,110 million.
- The above figure is made up of the sum of the total venture capital figures for each of the years in the decade in the OECD data: 2010 — US$ 78,383,157 millions; 2011 US$ 107,911,902 millions; 2012 US$ 93,637,512 millions; 2013 US$ 111,541,986 millions; 2014 US$ 159,484,801 millions, 2015 US$ 178,191,570 millions; 2016 US$ 177,823,297 millions; 2017 US$ 192,684964,309 millions; 2018 US$ 307,648,373 millions; 2019 US$ 309,677,071 and 2020 US$ 35,902,930 millions.
Research strategy
For this research, we leveraged the most reputable sources
of information that were available in the public domain, including figures published by the OECD, a report by a professor of investment banking at Harvard Business School and Statista. A number of the sources that were reviewed provided information over a period that spanned more than one decade or only focused on a few years within a decade. The sources used allowed actual figures or an estimate to be provided for the full decade. To obtain suitable figures and the information provided it was necessary to provide some sources which are older than we would normally provide.