Part
01
of one
Part
01
United States Farming Landscape
Key Takeaways
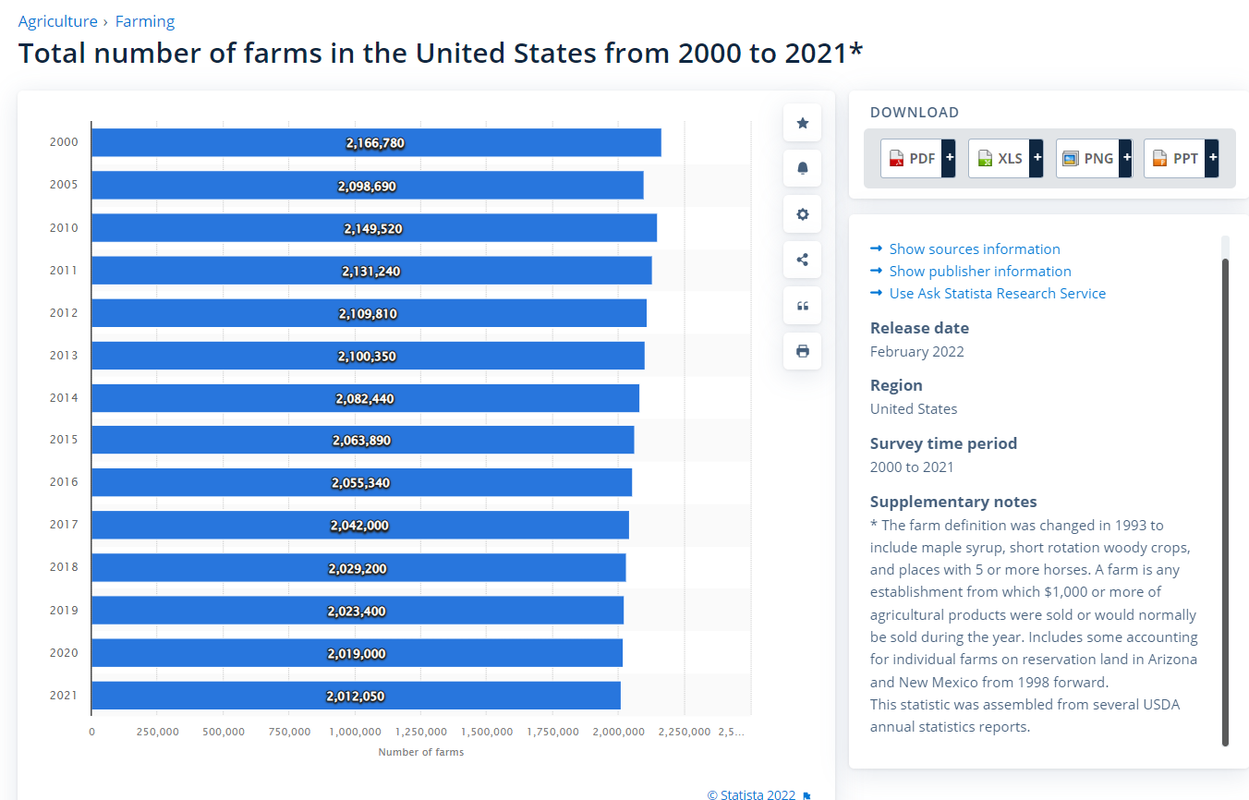
- The United States had 2,109,810 farms ten years ago (2012 precisely) compared to 2,012,050 farms in 2021. In 2011, the country had 2,131,240 farms.
- The 2012 US Census of Agriculture publication reported that 5.06% of US farms were corporate farms made up of family corporations (4.51%) and non-family corporations (0.55%). The rest of the farms are small family-owned. Also, a report released on January 22nd, 2021 revealed that 96% of the farms in the country are family-owned and operated. Additionally, these family-owned farms hold just 87% of farmlands and account for 82% (in value) of all agricultural products sold.
- The US produces an average of 14 billion bushels (356 million tonnes) of corn annually. Annually, the country also harvests an average of 4 billion bushels of soybeans, 1.8 billion bushels of wheat, 160 million bushels of barley, and 53 million bushels of oats.
- The ten (10) largest agricultural companies in the United States by revenue are Cargill, Tyson Foods, AGCO, The Mosaic Company, Perdue Farms, Pioneer Hi-Bred International (parent company, Corteva, Inc.), Seaboard Corporation, CF Industries Holding, Dole Food Company, and Fresh Del Monte Produce.
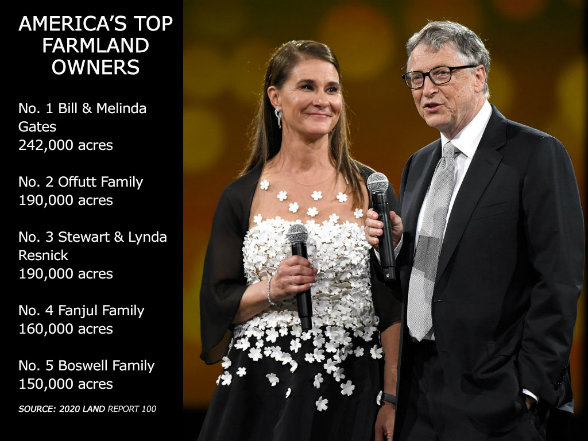
- The biggest family-owned farm owners in America by acreage are Bill Gates (242,000 acres), Offutt Family (190,000 acres), Stewart & Lynda Resnick (190,000 acres), Fanjul Family (160,000 acres), Russell Gordy (155,000 acres), Boswell Family (150,000 acres), Gaylon Lawrence Jr. (115,000 acres), Scully Family (106,725 acres), Larsen Farms (87,104 acres), and Simplot Family (82,500 acres).
Introduction
The research provides insights into the number of operational farms in the United States today compared to 10 years ago, the share of these farms that are individual/family-owned compared to the percentage owned by conglomerates, growth in farming by conglomerates, and the crops American farmers are planting, including the market shares of the largest agricultural companies in the United States by revenue and the largest family-owned farms by acreage.
Note that for this research, we have compared the number of farms in the US between 2012 and 2021, instead of 2022, as data for the current year (2022) is yet to be published by USDA NASS since the organization publishes the report quinquennial, with the last report published in 2017 and the latest scheduled for 2022 is yet to be released.
Additionally, all top players in the US agricultural market have a global footprint. Therefore, we have used only the revenue generated by their US businesses to calculate their market shares, while we used the regional (North American) revenue for the companies that failed to provide their US revenue in their annual report.
An outline of the calculations performed to obtain the required market shares is contained in the Research Strategy section.
United States Farming Landscape: Insights
The Number of Operational Farms: Current Vs. 10 Years Ago
- According to an industry report by Statista corroborated by USDA NASS and Farm Progress, the United States had 2,109,810 farms ten years ago (2012 precisely) compared to 2,012,050 farms at the end of 2021.
- Between 2020 and 2019, the United States lost 4,400 licensed farms.
- The number of farms in the US has been on a steady decline since 2007, when the country had about 2.2 million farms.
- In its most recent survey, USDA reported that the were 2.02 million farms in the US in 2020 compared to 2.20 million in 2007.
- With "897 million acres of land in farms in 2020, the average farm size was 444 acres, only slightly greater than the 440 acres recorded in the early 1970s."
- The number of farms in the country for other selected years since 2000 is provided in the second image below.

Individual/Family-Owned Vs. Conglomerate-Owned Farms
For 2012
- The 2012 US Census of Agriculture publication reported that 5.06% of US farms were corporate farms made up of family corporations (4.51%) and non-family corporations (0.55%). The rest of the farms are small family-owned.
- Given that in 2012, there were 2,109,810 farms in the US, therefore, there were 11,604 non-family corporate farms (i.e., 0.55% of 2,109,810 farms) in the United States.
- 98% of the family farm corporations are small corporations, with 10 or fewer stockholders.
- Likewise, for the non-family farm corporations, 90% or 10,444 farms (i.e., 90% of are 11,604) are small corporations, having 10 or fewer stockholders.
- In the same year, family farms (including family corporate farms) constituted 96.7% of US farms and 89% of the US farmland area.
Current Status
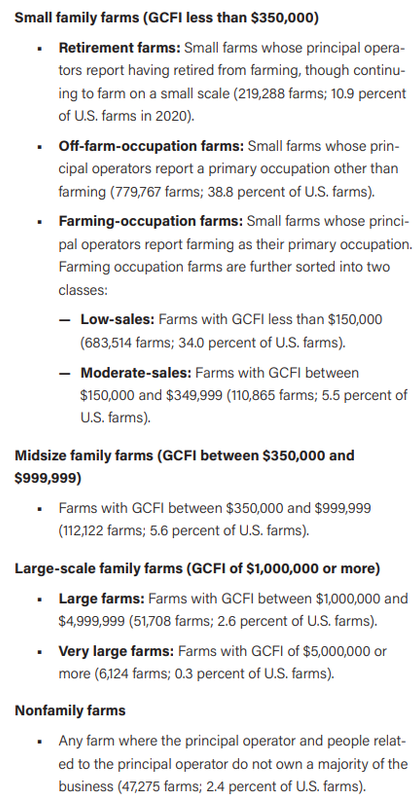
- According to America’s Diverse Family Farms: 2021 Edition, non-family farms constituted 2.4% of U.S. farms (47,275 farms).
- A report released on January 22nd, 2021 revealed that 96% of the farms in the country are family-owned and operated. Additionally, these family-owned farms hold just 87% of farmlands and account for 82% (in value) of all agricultural products sold.
- As of 2020, family farms constituted 98% of U.S. farms and accounted for 86% of farm production.
- A pictorial representation of the current distribution of farms in the US is contained in the second image below.

Growth in Farming by Conglomerates
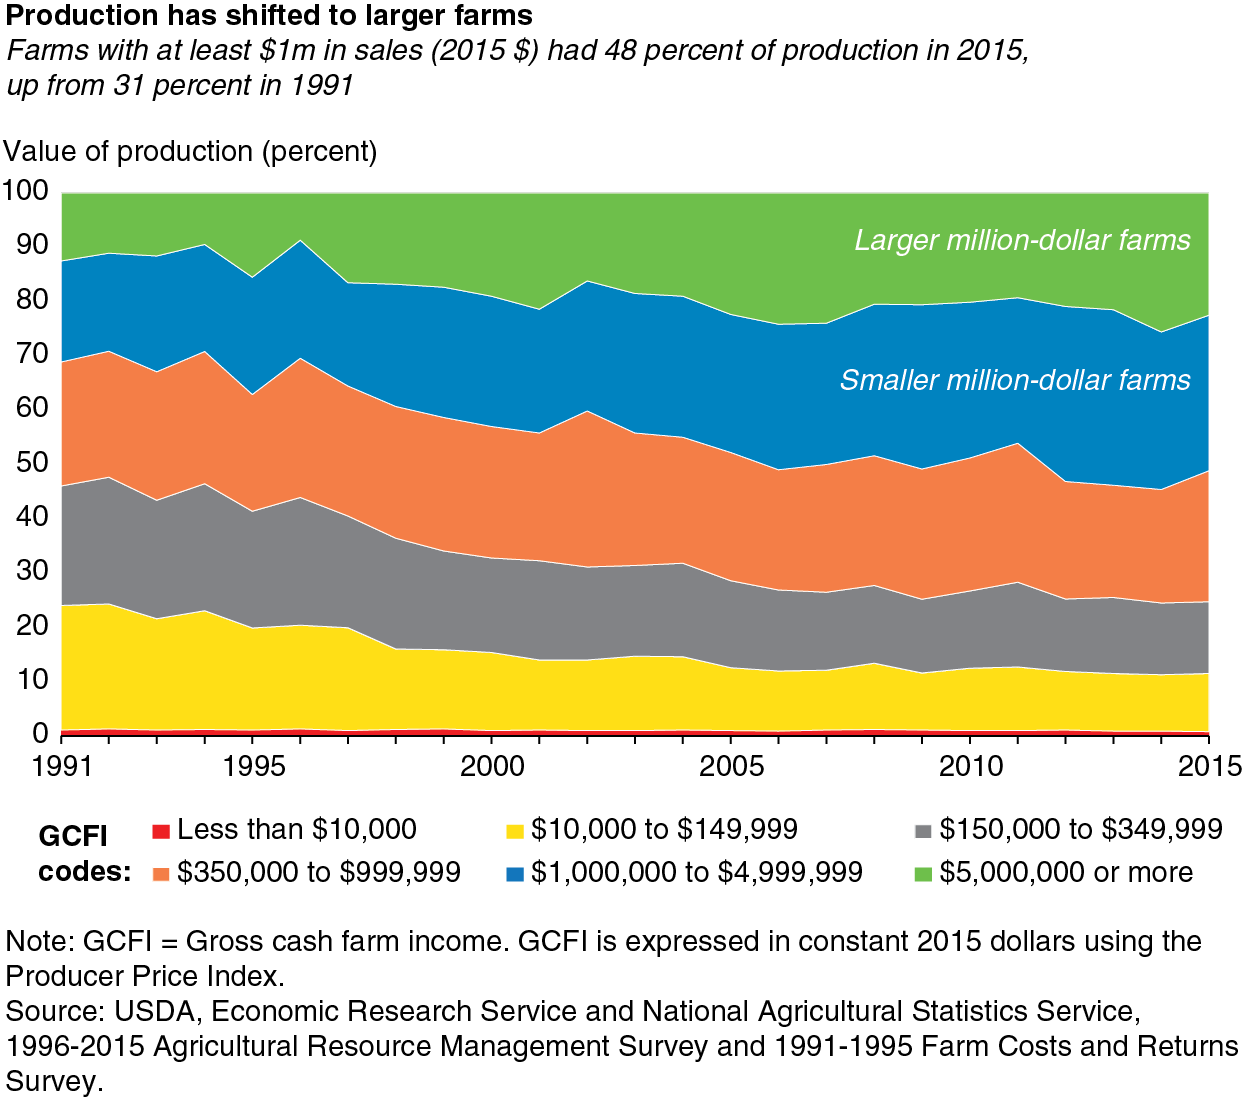
- A report by USDA’s Economic Research Service revealed that "family farms are the beating heart of U.S. agriculture with small farms (gross cash income below $350,000) constituting 90% of farms in the country and 22% of production."
- However, the share of small and family-owned farms has remained steady, while delivering less of the farm produce in the country.
- The "percentage of total farmland and amount of production small farms make up is down over the past 10 years, meaning big farms are getting bigger and are increasing production faster."
- The number of non-family farms in the US increased by 18% to 82,885 enterprises between 2012 and 2017.
- As of 2017, "non-family farms handled 116 million acres of U.S. farmland areas (47 million hectares), which represented an 8% increase as compared to 2012. Additionally, the sales of rose 13% to $70.4 billion between 2012 and 2017 reaching a share of 20% in the national agricultural sales."
- Christine Whitt, an agricultural economist for the USDA reported that in 2020, most U.S. farms were small family farms and operated nearly half of U.S. farmland while accounting for just 20% of farm production.
- Data from the US farm typology report showed that the number of family farms fell by 4% (almost 80,000 farms) since 2012.
- As per the fall, large and mid-size family farms were most hit, experiencing a decrease of 13% and 8%, respectively, while small family farms underwent a 3% decrease.
- The American Farmland Trust "estimated in 2018 that up to 370 million acres of farmland in the US – or nearly four times the total land area of California – could change ownership in the following 20 years."
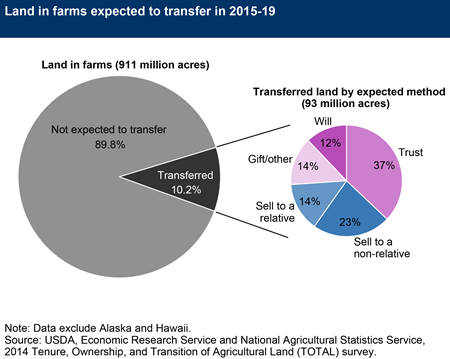
- Furthermore, 10% (93 million acres) of all US land in farms was expected to change ownership between 2015 and 2019, of which, 23% was to be sold to a non-relative owner.
- The rise in production by large corporate farms is attributed to factors such as favorable government policies and the competitive advantage resulting from economies of scale.
What is Being Farmed?
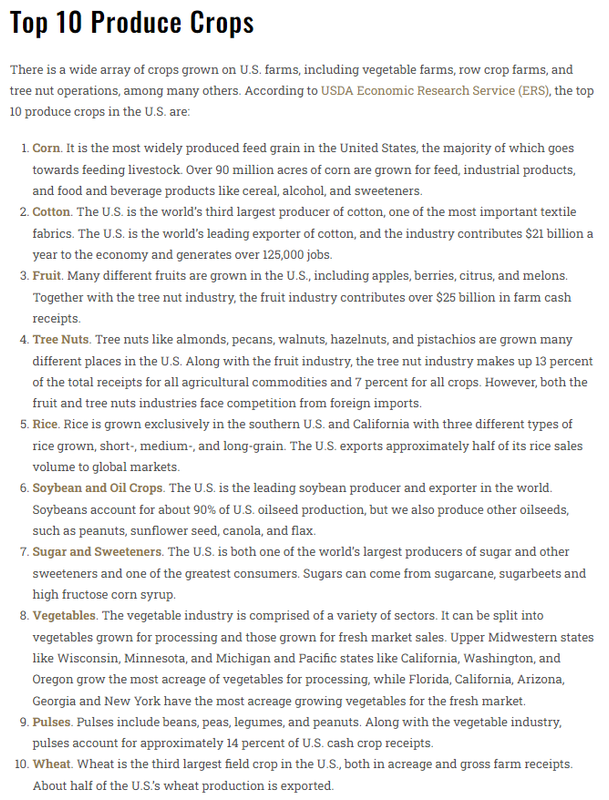
- America's most grown crops are "oats, barley, rice, sorghum, cotton, durum wheat and spring wheat, winter wheat, hay, soybean, and corn."
- In the United States, corn, wheat, soybeans, cotton, and hay make up 90% of harvested acreage.
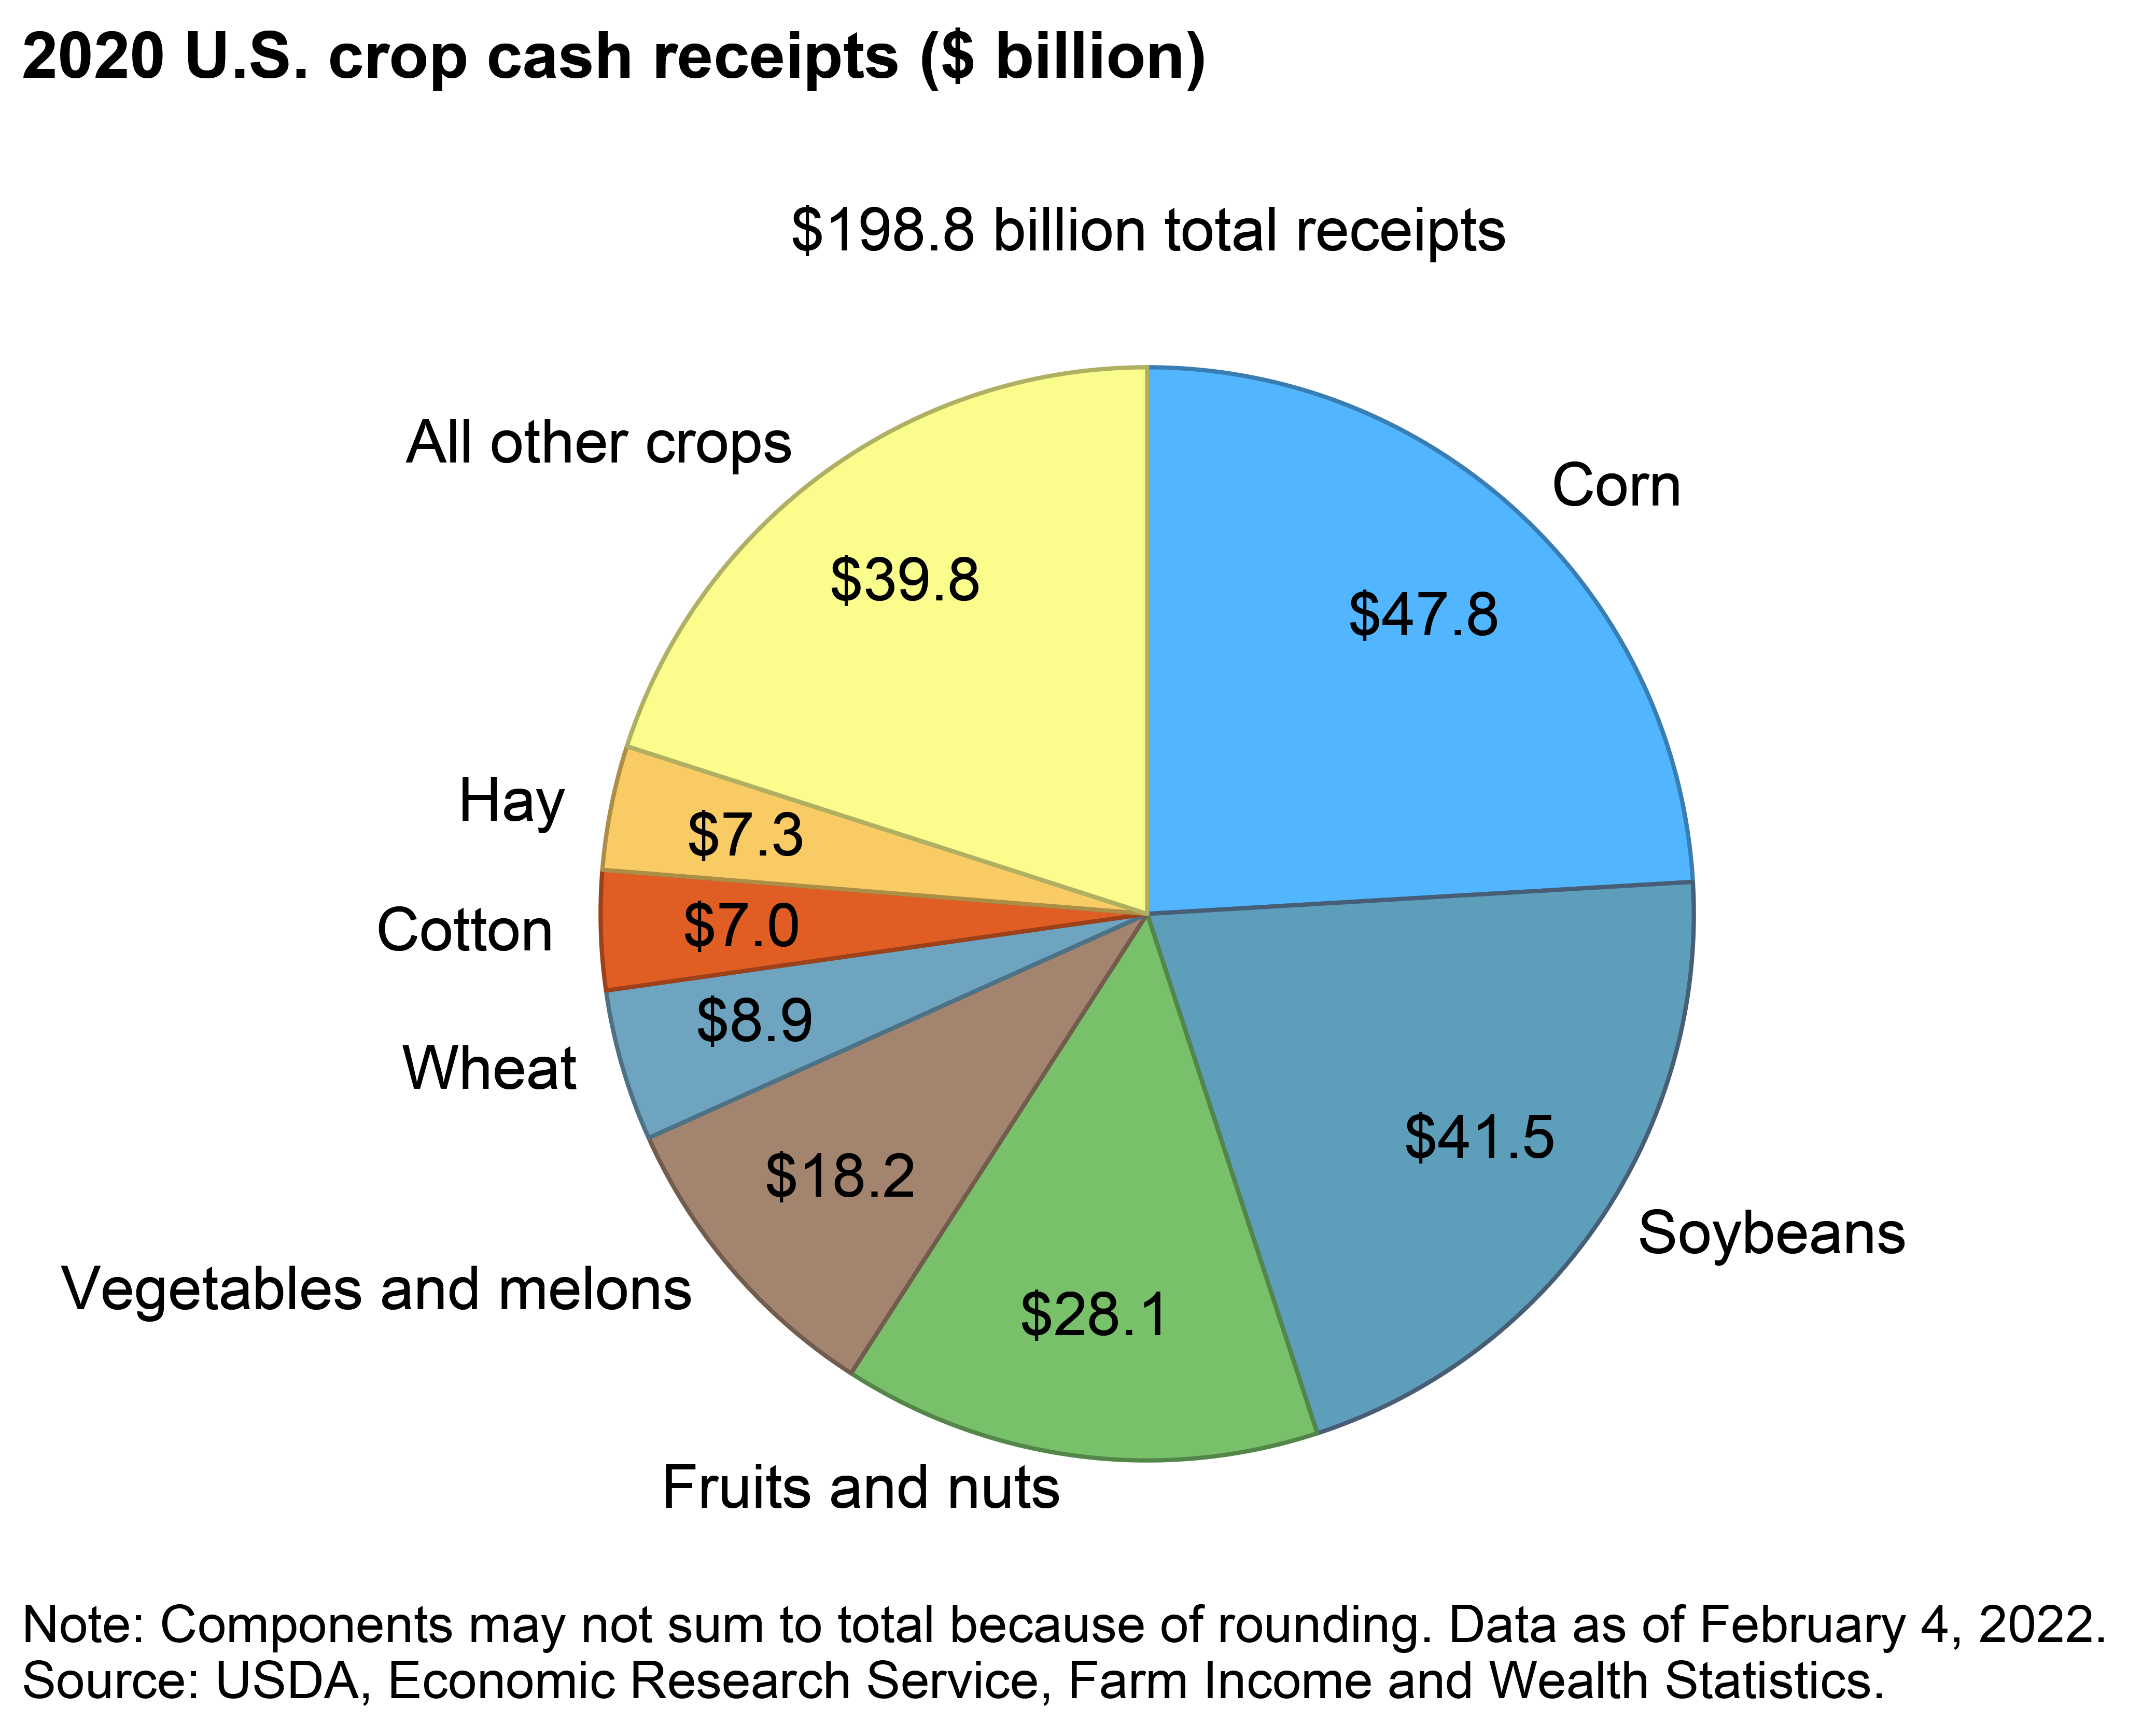
- In 2020, corn and soybeans contributed more than 40% of the crop cash receipts.
- The US produces an average of 14 billion bushels (356 million tonnes) of corn annually.
- Annually, the country also harvests an average of 4 billion bushels of soybeans, 1.8 billion bushels of wheat, 160 million bushels of barley, and 53 million bushels of oats.
The Biggest Agricultural Companies By Revenue
- The ten (10) largest agricultural companies in the United States by revenue are:
- Cargill: (34% of $134.4 billion) = $45.697 billion
- Tyson Foods: $4.9 billion
- AGCO: $1.7874 billion
- The Mosaic Company: $3.9293 billion
- Perdue Farms: $7.1 billion
- Pioneer Hi-Bred International (parent company, Corteva, Inc.): $6.782 billion
- Seaboard Corporation: $2.031 billion
- CF Industries Holding: $5.086 billion
- Dole Food Company €1.296 billion = $1.533 billion (average exchange rate in 2021: 1.183 USD)
- Fresh Del Monte Produce: $2.5702 billion.
Market Share
- The market shares of the top agricultural companies in the United States by revenue are calculated as thus:
- Cargill: 8.95%
- Tyson Foods: 1%
- AGCO: 0.35%
- The Mosaic Company: 0.77%
- Perdue Farms: 1.4%
- Pioneer Hi-Bred International (parent company, Corteva, Inc.): 1.33%
- Seaboard Corporation: 0.4 %
- CF Industries Holding: 1%
- Dole Food Company: 0.3%
- Fresh Del Monte Produce: 0.5%.
Biggest Family-Owned Farm By Acreage
- The biggest family-owned farm owners in America by acreage are:
- Bill Gates: 242,000 acres
- Offutt Family: 190,000 acres
- Stewart & Lynda Resnick: 190,000 acres
- Fanjul Family: 160,000 acres
- Russell Gordy: 155,000 acres
- Boswell Family: 150,000 acres
- Gaylon Lawrence Jr.: 115,000 acres
- Scully Family: 106,725 acres
- Larsen Farms: 87,104 acres
- Simplot Family: 82,500 acres.
Market Share
- The market shares of these farms are calculated as thus:
- Bill Gates: 0.027%
- Offutt Family: 0.0212%
- Stewart & Lynda Resnick: 0.0212%
- Fanjul Family: 0.0178%
- Russell Gordy: 0.0173%
- Boswell Family: 0.0167%
- Gaylon Lawrence Jr.: 0.0128%
- Scully Family: 0.0119%
- Larsen Farms: 0.00971%
- Simplot Family: 0.0092%.
Research Strategy
For the research, we have compared the number of operational farms in the United States between 2012 and 2021, instead of 2022. This is because the U.S. Department of Agriculture’s (USDA) National Agriculture Statistical Service (NASS) publishes the Census of Agriculture quinquennial, with the last version being completed in 2017.
For the market share calculation, since all the top players in the US agricultural market have a global footprint, we have used the revenue for their US businesses to calculate their market shares. For the companies that failed to provide their US revenue in their annual report, we have used the regional (North American) revenue for our calculations.
To provide the list of top agricultural companies and the biggest family-farm owners in the United States, we leveraged pre-compiled lists provided by Yahoo Finance and Successful Farming.
Below you'll find an outline of the calculations performed to obtain the required market shares.
Triangulation
For the Leading Agriculture Companies by Revenue
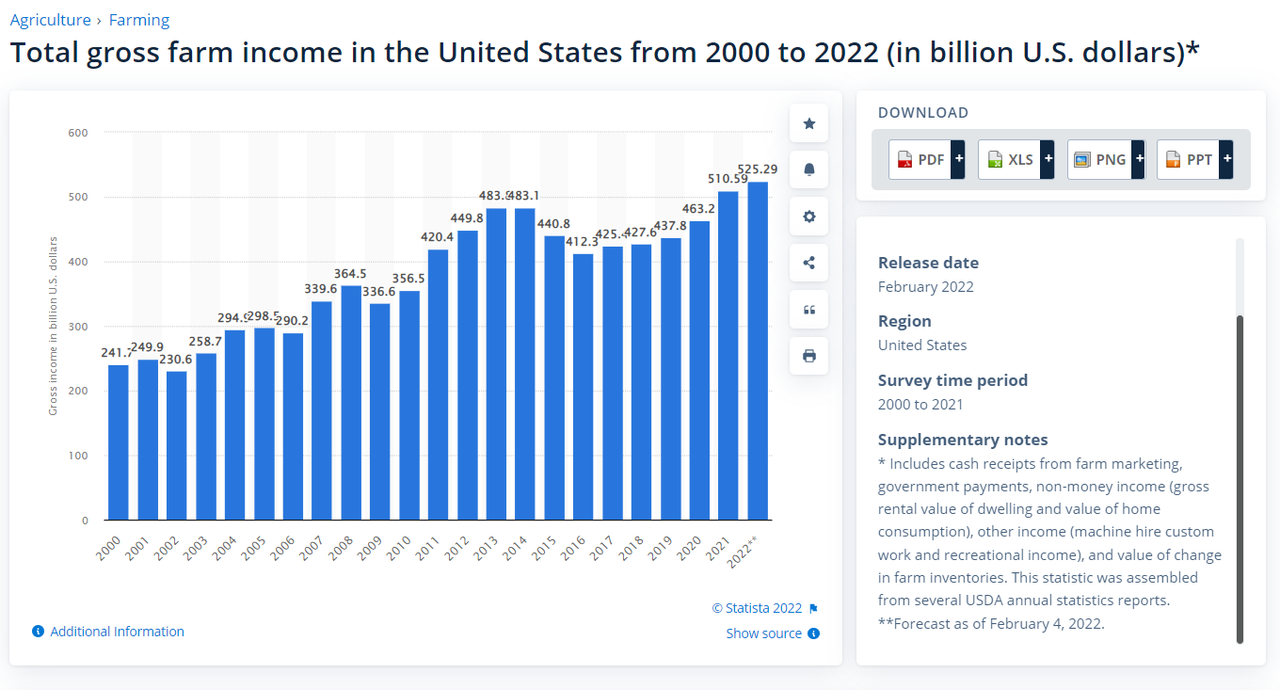
- Based on the report by USDA corroborated by Statista, the 2021 gross cash farm income (GCFI) was $510.59 billion.
- The market share of the top agricultural companies by revenue is calculated by expressing the revenue of each company as a percentage of the GCFI ($510.59 billion) = [(revenue of the top player ÷ GCFI) × 100].
- Therefore, the market shares of these companies are calculated as thus:
- Cargill: [($45.697 billion ÷ $510.59 billion) × 100] = 8.95%
- Tyson Foods: [($4.9 billion ÷ $510.59 billion) × 100] ≈ 1%
- AGCO: [($1.7874 billion ÷ $510.59 billion) × 100] = 0.35%
- The Mosaic Company: [($3.9293 billion ÷ $510.59 billion) × 100] = 0.77%
- Perdue Farms: [($7.1 billion ÷ $510.59 billion) × 100] = 1.4%
- Pioneer Hi-Bred International (parent company, Corteva, Inc.): [($6.782 billion ÷ $510.59 billion) × 100] = 1.33%
- Seaboard Corporation: [($2.031 billion ÷ $510.59 billion) × 100] =0.4 %
- CF Industries Holding: [($5.086 billion ÷ $510.59 billion) × 100] ≈ 1%
- Dole Food Company: [($1.533 billion ÷ $510.59 billion) × 100] = 0.3%
- Fresh Del Monte Produce: [($2.5702 billion ÷ $510.59 billion) × 100] = 0.5%
For the Top Family-Owned Farms by Acreage
- Based on a report published by USDA on February 04, 2022, the United States has 897 million acres of land in farms.
- The market share of the largest family-owned farm owners in America by acreage is calculated by expressing the total number of acreage of each farm owner as a percentage of the total acres of land in farms (897 million acres) = [(revenue of the top player ÷ the total acres of land in farms) × 100].
- Therefore, the market shares of these farms are calculated as thus:
- Bill Gates: [(242,000 acres ÷ 897 million acres) × 100] = 0.027%
- Offutt Family: [(190,000 acres ÷ 897 million acres) × 100] = 0.0212%
- Stewart & Lynda Resnick: [(190,000 acres ÷ 897 million acres) × 100] = 0.0212%
- Fanjul Family: [(160,000 acres ÷ 897 million acres) × 100] = 0.0178%
- Russell Gordy: [(155,000 acres ÷ 897 million acres) × 100] = 0.0173%
- Boswell Family: [(150,000 acres ÷ 897 million acres) × 100] = 0.0167%
- Gaylon Lawrence Jr.: [(115,000 acres ÷ 897 million acres) × 100] = 0.0128%
- Scully Family: [(106,725 acres ÷ 897 million acres) × 100] = 0.0119%
- Larsen Farms: [(87,104 acres ÷ 897 million acres) × 100] = 0.00971%
- Simplot Family: [(82,500 acres ÷ 897 million acres) × 100] = 0.0092%.