Part
01
of one
Part
01
Triple Diamond + Design Thinking Framework
The research team has curated a list of key deliverables associated with each phase of the Triple Diamond + Design Thinking diagram. Considering the intended use of this custom framework, the associated selection of work products was sourced from only the most credible institutions, including design thought leaders (e.g., Interaction Design Foundation), scientific journals (e.g., PoliPapers) and business case studies. Moreover, each physical deliverable was identified based on its recommended use specifically in support of the Triple Diamond, Design Thinking and/or Lean Startup methodologies. In cases where relevant deliverables were applicable only to digital or web products (e.g., sitemap creation during Stage 2), these work outputs were excluded. Additionally, in cases where a large variety of work outputs were available to support a step, the most widely cited were selected (with other options also listed below). These validated, hand-picked work outputs have been added to the one-page diagram that was drafted during the first hour of research (available at this link) as well as cataloged below for additional reference purposes, as helpful.
Stage 1a
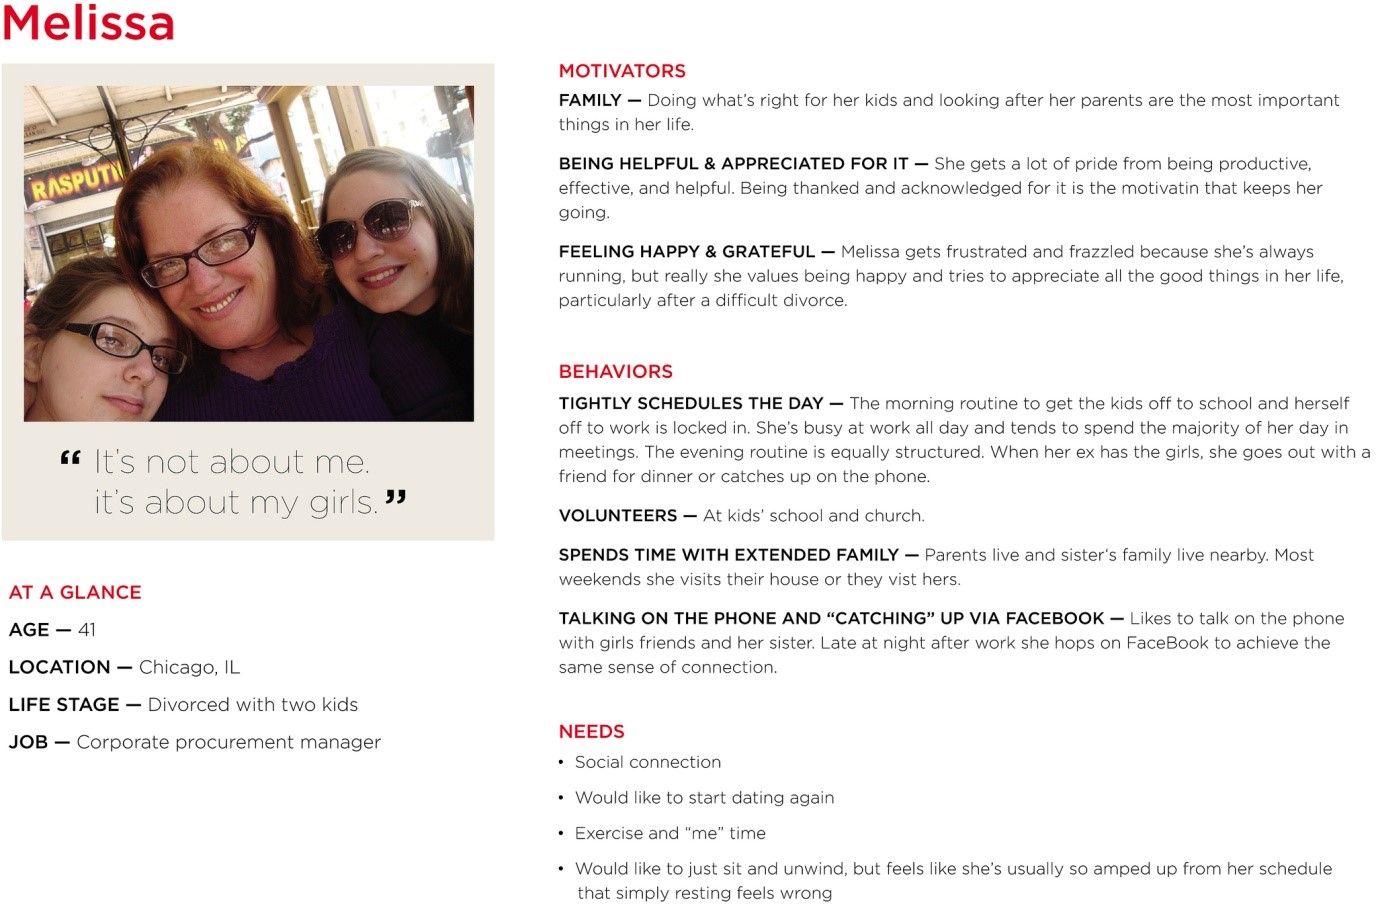
- User Personas: User personas are clearly defined profiles that are created for each of the different "users whose problems a team wants to solve." User personas generally include information about a typical user's goals, motivations, frustrations, education level and other relevant demographic/psychographic characteristics. These user personals help designers empathize with a specific audience.
- Empathy Maps: Consisting of four quadrants (as depicted below), empathy maps capture and organize the "four key traits" that users demonstrate surrounding the problem in question.
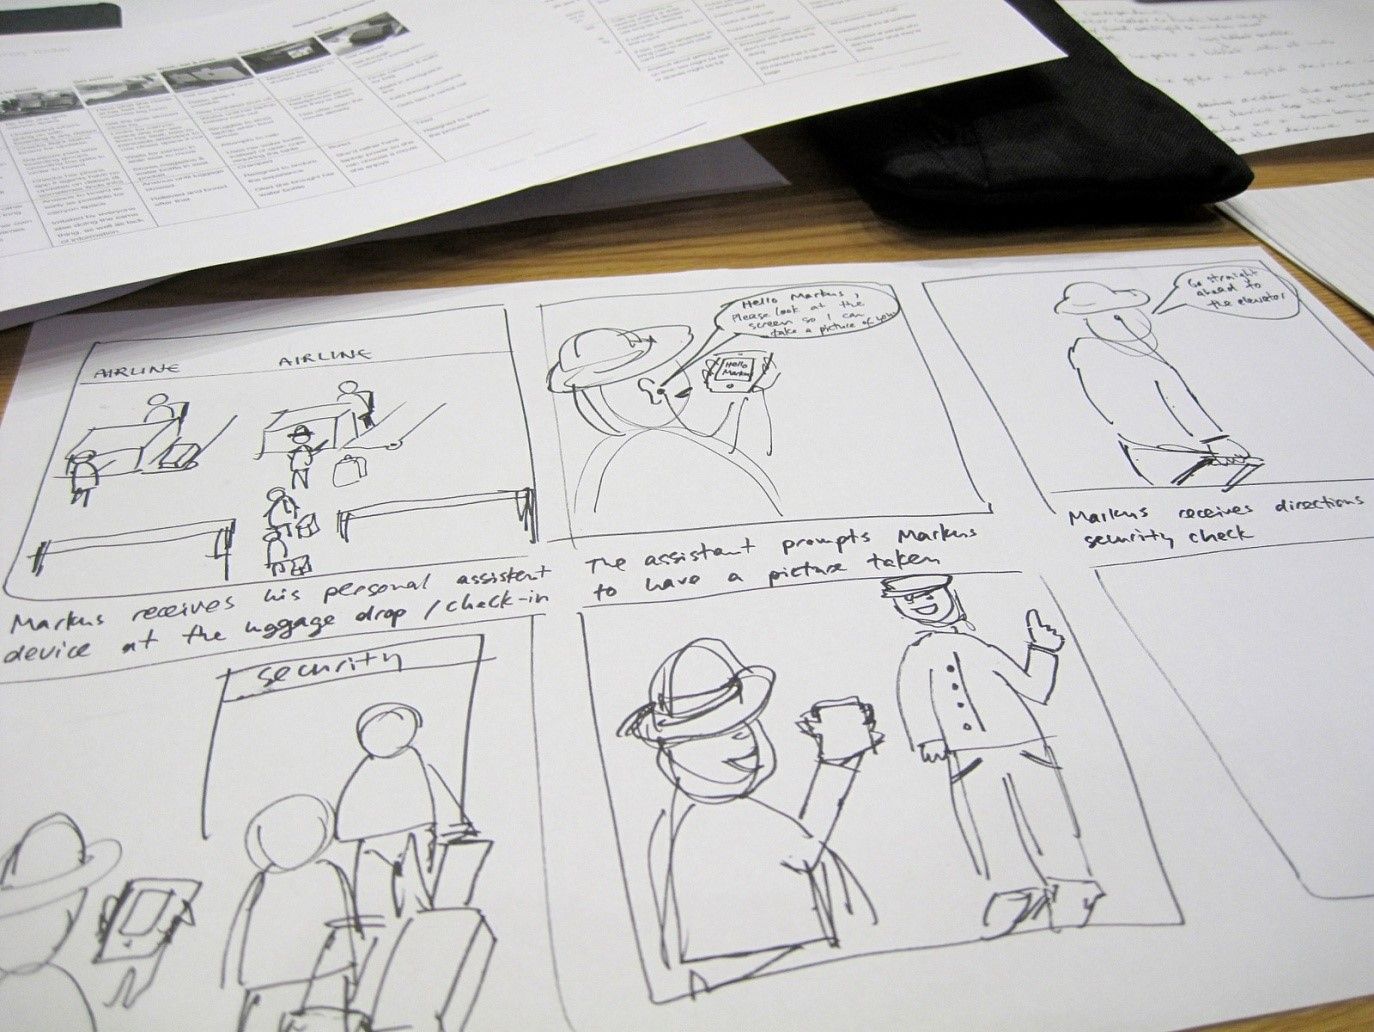
- Storyboard: Perhaps one of the most widely recommended deliverables across the Triple Diamond, Design Thinking and Lean Startup methodologies, storyboards can also be leveraged throughout multiple stages of the design process, including Stage 1a, Stage 1d and Stage 2. Storyboards in simple terms are a "comic strip" that outlines a user's actions and circumstances, thereby codifying both a potential customer's behavior as well as how the environment may motivate user behavior.
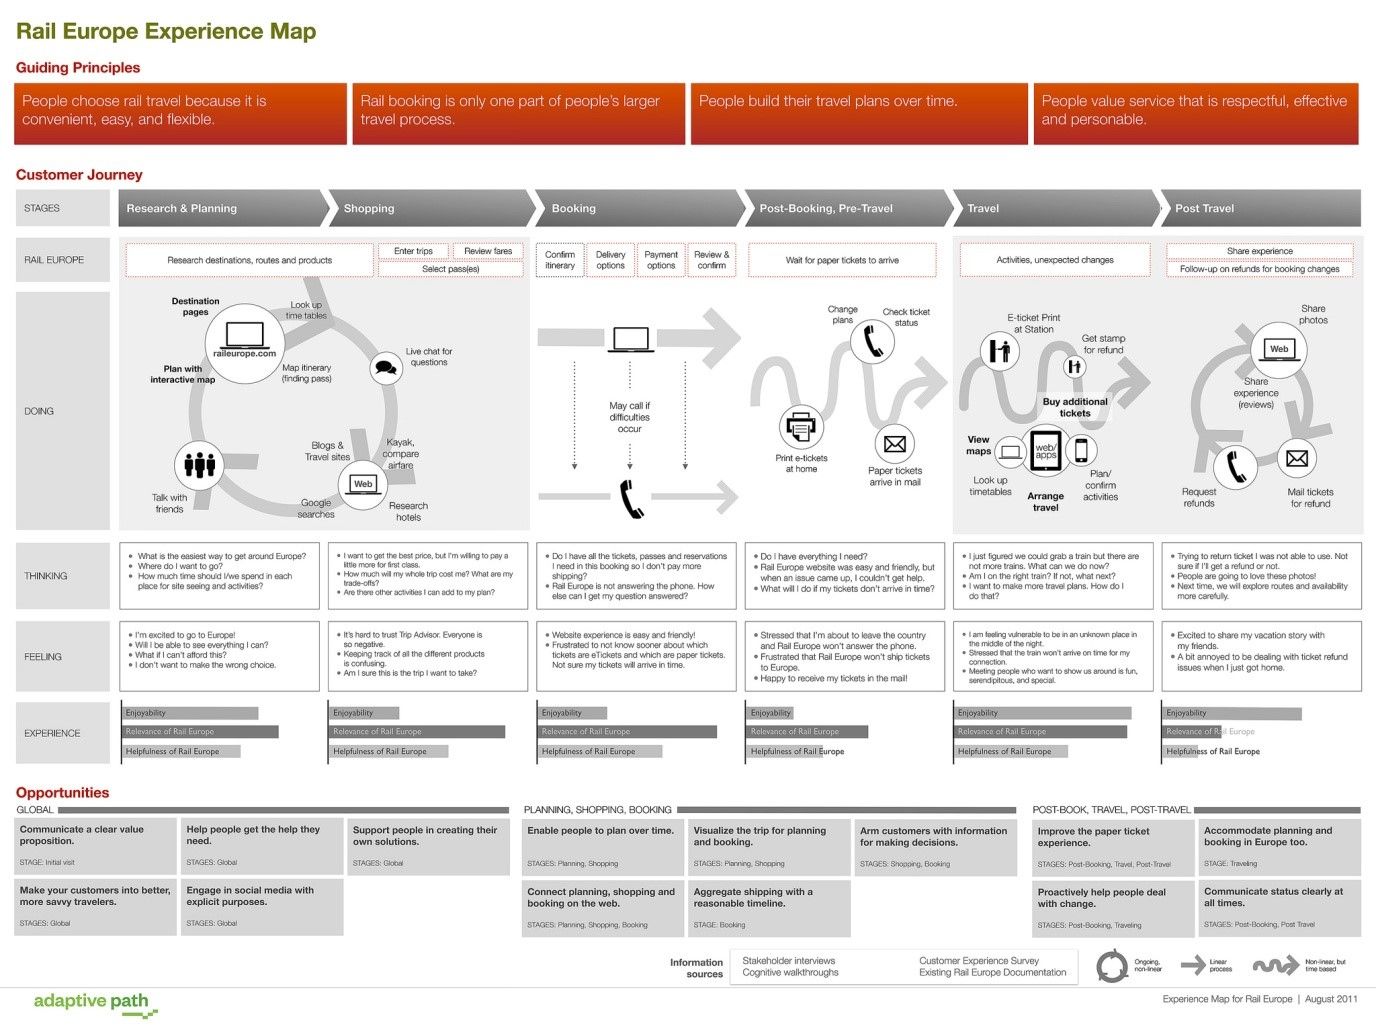
- Customer Journey Map: Also referred to as an Experience Map, a customer journey map is a diagram that outlines a user's steps along a timeline, enabling a design team to understand the evolution of a user's motivations/problems/needs and associated context.
- Other recommended deliverables: Photo and Video User-based Studies, Personal Photo and Video Journals, User Interviews, Analogies, Bodystorming Analysis, Lighting Talks, Affinity Mapping.
Stage 1b
- Problem Statement: Specifically in the context of product design, it is recommended that problem statements take the form of a Point Of View (POV) statement. These statements define the challenge that a team has chosen to address, and present this selected mission in an actionable manner. Three elements are necessary to create an effective problem statement: user, need and insight, or "[User (descriptive)] needs [need (verb)] because [insight (compelling)]."
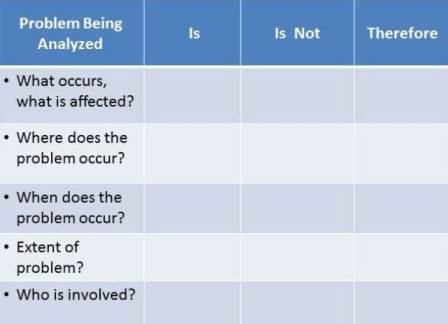
- Is/Is Not Matrix: This deliverable helps a design team isolate the "who, what, when, and where about a problem." By doing so, critical factors are identified and extraneous considerations are eliminated.
- How Might We Questions: These questions help facilitate the transition from the problem statement to solution discovery. The questions begin with "how might we" or "in what ways might we," and refer to specific aspects of the identified problem. If executed correctly, they can help "spark" the next stage of ideation.
- Why-How Ladder: Another crossover deliverable, the why-how ladder guides a design team from broadly defining the problem (the why) to more specifically identifying actionable components (the how).
Stage 1c
- Brainstorming Map: The result of a process whereby a design team generates "as many ideas as possible" for addressing the problem statement. These ideas should explore all angles of a problem and include even the "craziest-sounding notions."
- Other recommended idea generation deliverables: Braindump, Brainwrite, Brainwalk, Challenge Assumptions, SCAMPER, Mindmap, Sketch or Sketchstorm, Analogies, Provocation, Movement, Bodystorm, Gamestorming, Cheatstorm, Crowdstorm, Co-Creation Workshops, Crazy 8 Development.
- Four Categories: This deliverable categorizes all brainstormed ideas into four categories (i.e., the rational choice, the most likely to delight, the darling, and the long shot). One to two ideas are selected from each of the four categories, thereby ensuring that a design team pursues a range of ideas that include the most practical as well as the most innovative.
- Other recommended idea selection deliverables: Post-it Voting or Dot Voting, Bingo Selection, Idea Affinity Maps, Now Wow How Matrix, Six Thinking Hats, Lean Startup Machine Idea Validation Board, Idea Selection Criteria, Pitching and Voting.
Stage 1d
- User Flow Diagram (or Solution Sketch): This flow chart outlines the steps a user will take with a design team's proposed product or service. Unlike a customer journey map, this diagram includes only what happens with a user and the design team's proposed product. Notably, user flow diagrams facilitate concept validation by quickly highlighting the efficiency of a proposed solution.
- SMART Goals: This deliverable clearly articulates the goals, requirements and criteria that will be used in evaluating a proposed solution as it enters the subsequent design and development stage. All proposed goals must be Specific, Measurable, Achievable, Relevant and Time-bound.
Stage 2
- Low-Fidelity Prototypes: These are basic models that enable a design team to consider an "overall view" of a potential product/solution in a quick and inexpensive manner. Examples include sketching, card sorting and Wizard of Oz.
- High-Fidelity Prototypes: These models appear and operate in a fashion that more closely resembles the intended solution. An example is a "3D plastic model with movable parts."
Stage 3
- Usability Report: Usability reports are the outcome of evaluations of a prototype, ranging from more qualitative evaluations (e.g., focus group with a prototype) to robust assessments (e.g., user test, as described below). A complete usability report includes the following components: background summary, methodology, test results and findings/recommendations.
- User Test: This deliverable involves introducing users to the developed prototype in a context/scenario that matches the intended environment where it will be used. Observations and feedback are captured, documented and reported.
Stage 4
- Business Case: This action plan for a selected solution considers how it will be launched, implemented, assessed and modified (if necessary) after commercial introduction. Key components include "tasks, dates, people in charge, participants, budget (resources and costs), and training plan."
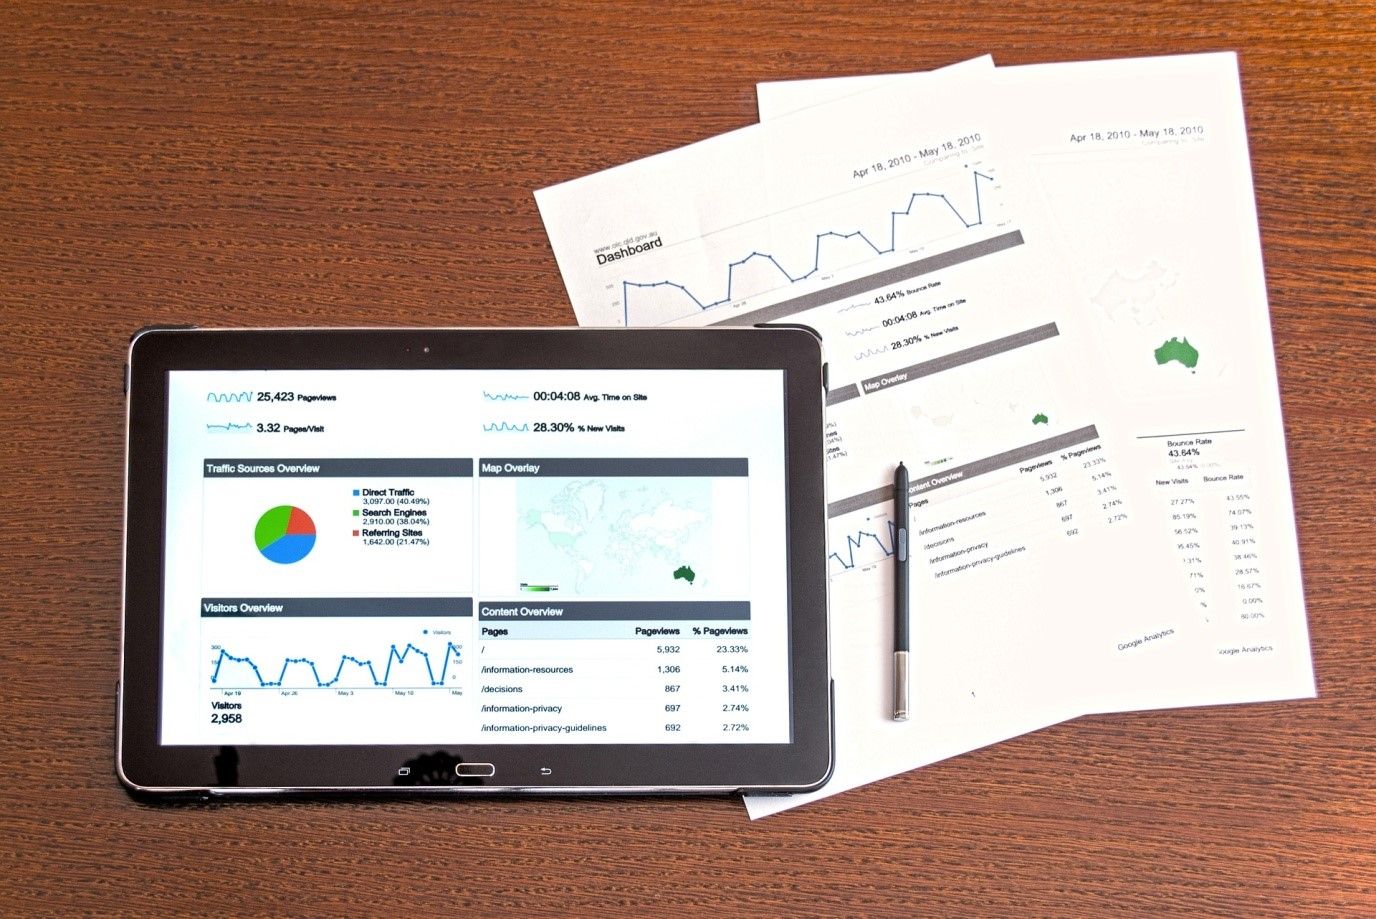
- Analytics Report: After a product's release, data is captured and analyzed to produce recommendations for how the design can be improved. This reporting must go beyond synthesizing data to delivery explanations and recommendations associated with the findings.
