Part
01
of one
Part
01
Solar Drone Inspection Companies
Insights are provided into the type of data used by solar drone inspection companies, how thermal and RBG imaging is combined, and how the data provided has been used by clients. General data on the types of algorithms used in thermal imaging was available, however the information was not sufficiently granular to drone imagery to include in this report. In its place three companies are identified that utilized machine learning in its drone inspections, along with how the data is used, and a link is provided to a short video on thermal analysis from one of the providers identified.
Why Drone Data for Solar Inspections?
- Using drones for solar panel inspections improves operational and cost efficiencies, promotes worker safety, provides a historical record for issues, and provides better quality and quantities of information compared to hand-held thermal cameras.
- Aerial inspections and aerial thermography are increasingly becoming an integral part of the financing requirements for solar panel farms because it provides vital data on the viability of the installed infrastructure and the potential for uninterrupted output.
- Additional use cases include the installation and design of roof solar panels and commercial prospecting and construction of solar farms.
What type of data is collected?
- The impairments inspections of solar panels are searching for include series losses, shunt losses, mismatch losses, reduced current losses, and reduced voltage losses.
- Qualitative and quantitative data is collected from drone inspections of solar panels by deploying both color imagery photogrammetry/RBG imaging and radiometric thermographic photogrammetry.
- Qualitative data refers to what is seen on the images produced by the thermal and RBG imagery. This type of data determines the type of defect on the panel.
- Quantitative analysis refers to temperature data derived from an analysis of pixels in the image using radiometric thermal cameras. This type of data is used to measure the severity of a defect.
How does it work?
- Thermal imagery maps the heat emitted by an object to either create an image of the object, or locate it. Using the infrared band of the electromagnetic spectrum, object temperature and anomalies can be detected.
- In aerial deployments, large target areas can be covered and the data produced helps the camera operator to identify areas of possible impairments from heat differentials within the image produced.
- When an infrared image displays an area of higher temperatures, it is an indication of solar energy being dissipated as heat instead of being converted to a current.
Algorithms
- Companies such as Raptor Maps, Scopito, and UAviation are using artificial Intelligence to provide analytics on data gathered during a solar panel inspection completed by drones.
- Machine learning algorithms are used to assist with processing the RBG and thermal imagery through detection, localization, and classification of anomalies. The benefit to the client is reporting that is improved, cost reductions, and reductions in oversights.
- The use of algorithms begins with the aerial inspection, followed by detection of the anomaly, localization of the issue, and then report generation. An overview of thermal analysis as provided by Scopito can be viewed at this link.
RBG & Thermal Imaging Combined
- RBG imagery refers to the combining of red, green, and blue hues of light to create images on electronic screens. Visible-light cameras assist in the process of solar panel inspection by drones by identifying non-electrical issues such as identification of animal nesting, shading, bird excrement, and other types of soiling.
- The use of RBG imagery or visible-light cameras complement thermal imagery by helping to identify instances of false positives identified as electrical anomalies. When thermal cameras equipped with RBG cameras are present in a drone sensor set, the operator has both the visible awareness and context to accurately identify irregularities.
- Anomalies that are identified by thermal imaging include ballast, cell anomalies, combiner, cracking, delamination, diode, hot spots, internal short circuits, inverter, junction box, modules (missing, heated, and spare), shadowing, soiling, string, tracker, and vegetation.
- Common causes of anomalies are manufacturer defect, installation damage, shading, soiling, cracking, vegetation, fuse or connector failure, weather events, module degradation, and sub optimal grounding. RBG images provide qualitative data to assist in determining these causes.
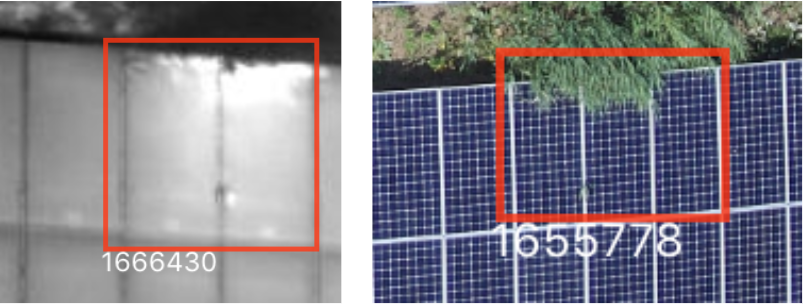
- An example of the application of the combined data from RBG imaging and thermal imaging to a potential solar panel impairment occurs when an area of higher temperatures on an infrared image, a potential heat loss, is revealed to be a place where vegetation is present.
Limitations
- Although the use of drones to inspect photo voltaic (PV) systems provides useful benefits, there are several limitations that should be considered.
- The ground sampling distance (GSD) required for different issues varies impacting on the optimal camera resolution to be used in identification of the impairment. Further, in-flight zoom capability is currently limited to RBG imaging.
- Inspections must occur when the level of irradiance exceeds 600W/m2 to provide a temperature reading that is accurate. Readings performed at lower levels degrades the quality of the data.
- Environmental conditions to be factored into camera operations to ensure optimal imaging include atmospheric transmission, relative humidity, air density, wind speed, moisture, and clouds.
Post Inspection
- Plant operators have used the data gained from deploying drones for solar panel inspections to identify the most impactful and easy to resolve onsite anomalies. Non-shading anomalies were addressed with a plan to resolve issues within two weeks of inspection, in a case where the client was aware of the shading issues, but it was not quantified.
- At a site where 10 malfunctioning strings, 379 diode faults, and more than 400 cases of vegetation shading was identified as the cause of over 600,000 kWh production loss, the operations team provided their vegetation management provider with the exact locations to be addressed, deployed field technicians to fix the 10 string anomalies, and query the cases of diode faults.
- At a site where four hot cells, six cracked modules, and one offline inverter was identified, the operations team deployed the exact labor requirement needed to fix each issue.