Part
01
of one
Part
01
Cable and OTT Reality TV Show Market Research
Key Takeaways
- In 2014, reality show episodes made up 57% of all TV shows.
- In 2015, cable TV networks aired about 750 reality shows.
- According to a Mr. Pop Culture website, the ratings and profits of reality TV shows have been declining since the late 2010s.
- 20% of Americans believe that cable TV networks, such as NBC, ABC, FOX CBS, PBS, and The CW, produce the best reality shows.
- 41% of the 35 – 54 age group prefer to watch cooking reality shows, such as Master Chef.
Introduction
The report below provides a market overview for reality TV in the US, including the percentage of reality TV shows on cable and OTT networks, growth/decline in popularity of reality shows for the past few years, most popular networks to watch on reality shows, most popular reality show, and a demographic style analysis regarding reality TV show consumption. Below is an in-depth overview of the research.
Percentage of Reality TV Shows on Cable TV and OTT Platforms
- The information on the recent percentage or number of reality shows on both cable TV and OTT networks in the US is limited in the public domain. Below is the most relevant information regarding reality shows in the US.
- According to a survey conducted by Writers Guild of America East in 2013 on nonfiction TV, reality TV shows accounted for 40% of prime-time television in 2013, an increase from 20% in 2011.
- In 2014, reality show episodes made up 57% of all TV shows.
- In 2015, cable TV networks aired about 750 reality shows (where more than 350 were new shows). This was 83% higher than the number of scripted shows.
- In 2019, over 500 scripted TV shows were aired on both cable TV and streaming platforms in the US, according to the FX network. This included 532 dramas, limited series, and comedies. This survey did not include reality shows, children's series, and daytime dramas. If those were included, the tally would have been more than 1,000.
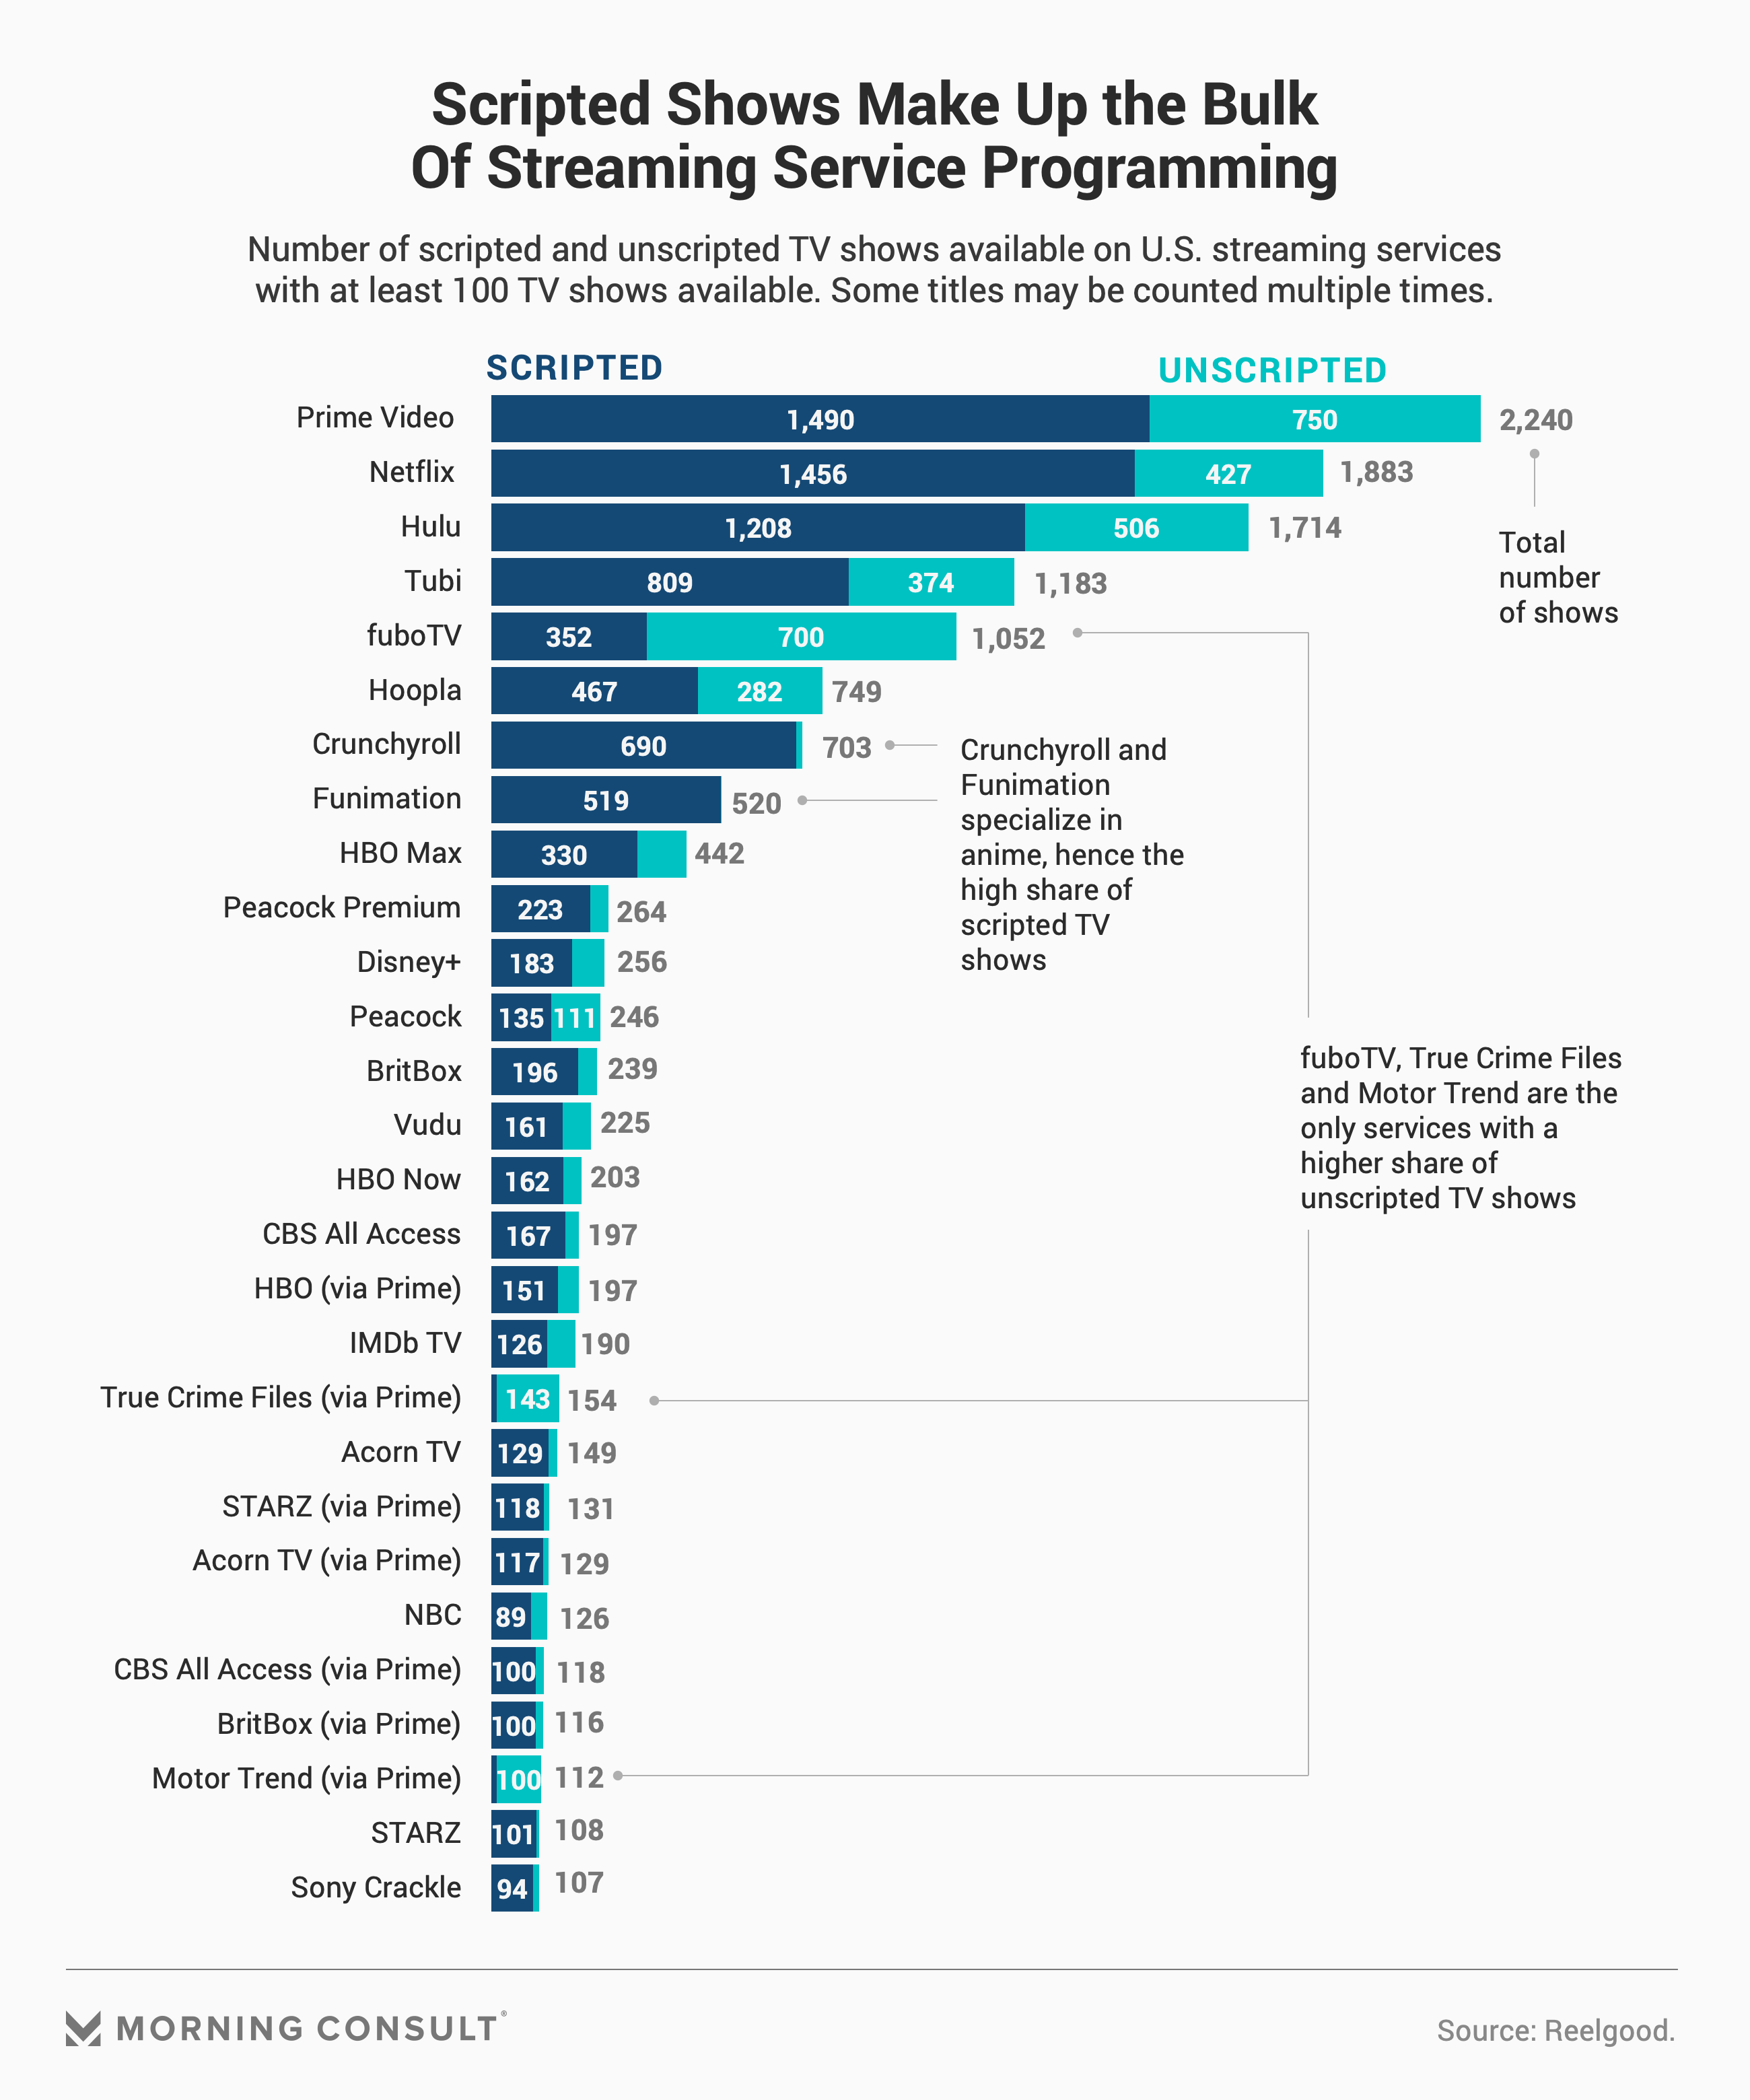
- According to a recent study by Morning Consult in 2020, it could be found that out of Prime Video’s 2,240 TV shows, 67% are scripted, i.e., 33% are unscripted. In addition, Netflix and Hulu have 23% and 30% of unscripted shows of their 1,883 and 1,714 shows, respectively. Reelgood defines unscripted shows as "reality TV series, documentaries, game shows, and talk shows."
- Of over 6,000 TV shows across 140 US OTT platforms, 68% are scripted while 32% are unscripted.
Growth/Decline in Popularity of Reality TV Shows in the Last 5 years
- The popularity of reality TV shows began declining as early as 2014, i.e., fewer shows were making it to the air. And according to Tom Nunan, a professor at UCLA School of Theatre Film and Television, "the US reality TV genre has stalled because of a lack of creativity and over-reliance on importing foreign formats."
- In 2016, the reality TV viewership on Netflix and Hulu increased to 28.3% and 10.3%, respectively, from 2015.
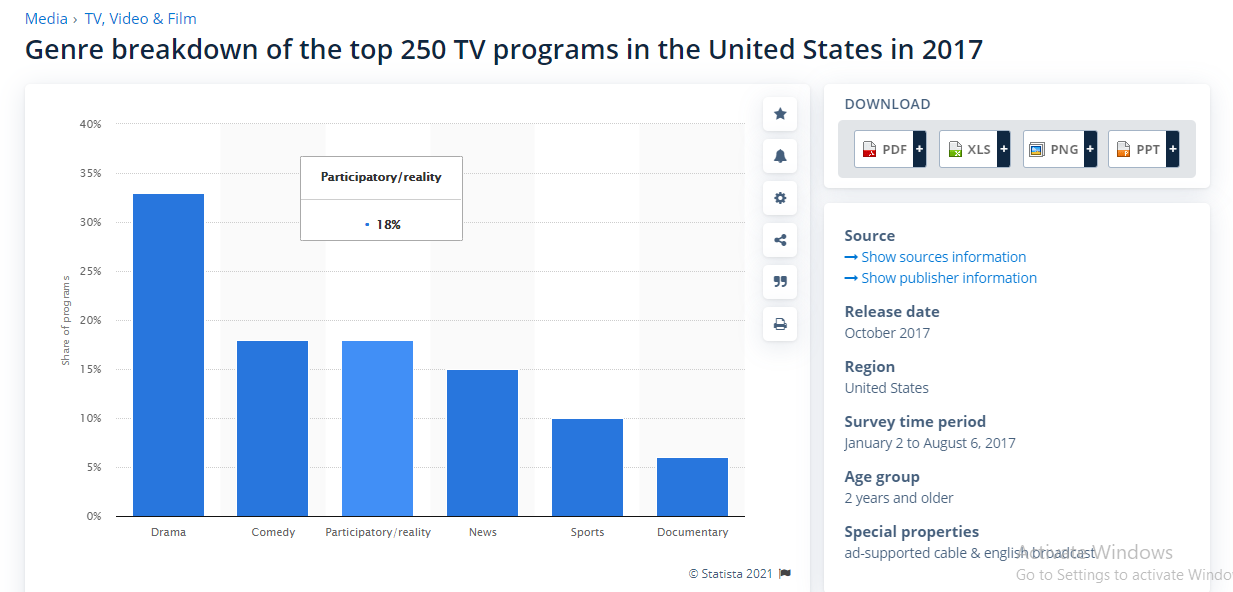
- 18% of the top 250 TV shows in 2017 were reality shows.
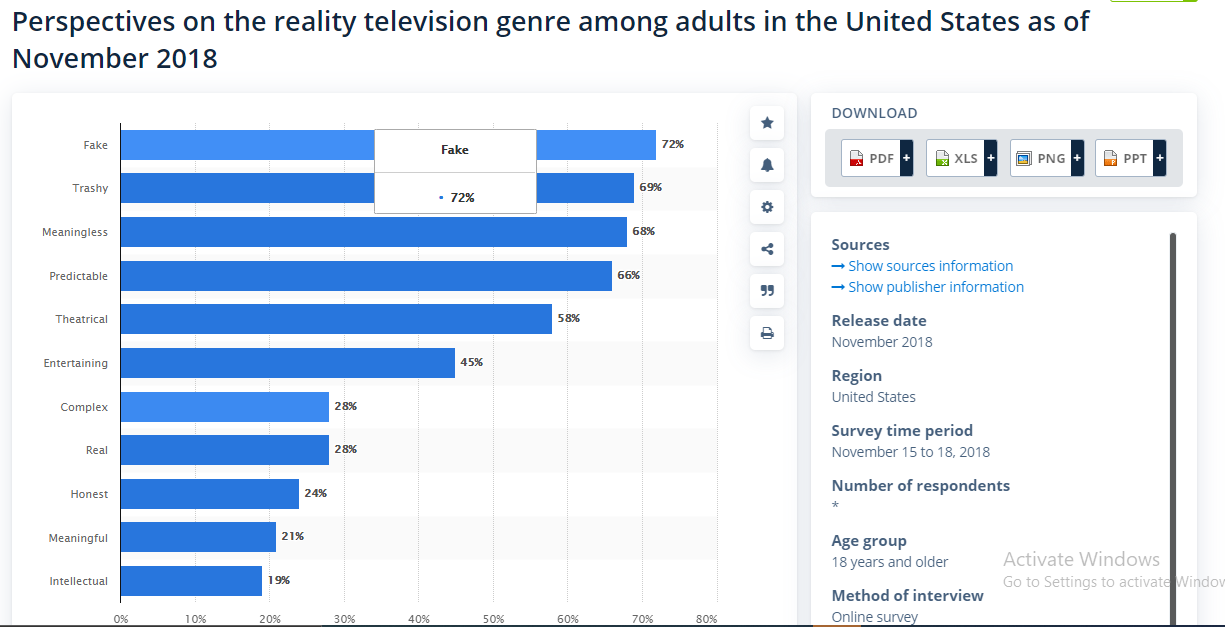
- Also, a 2018 survey revealed that reality shows were the least favorite genre among all age groups, where 72% of correspondents said it's fake, 69% - thrashy, and 68% said it's meaningless.
- According to a Mr. Pop Culture website, the ratings and profits of reality TV shows have been declining since the late 2010s.
Most Popular Cable TV and OTT Platforms to Consume Reality TV Shows
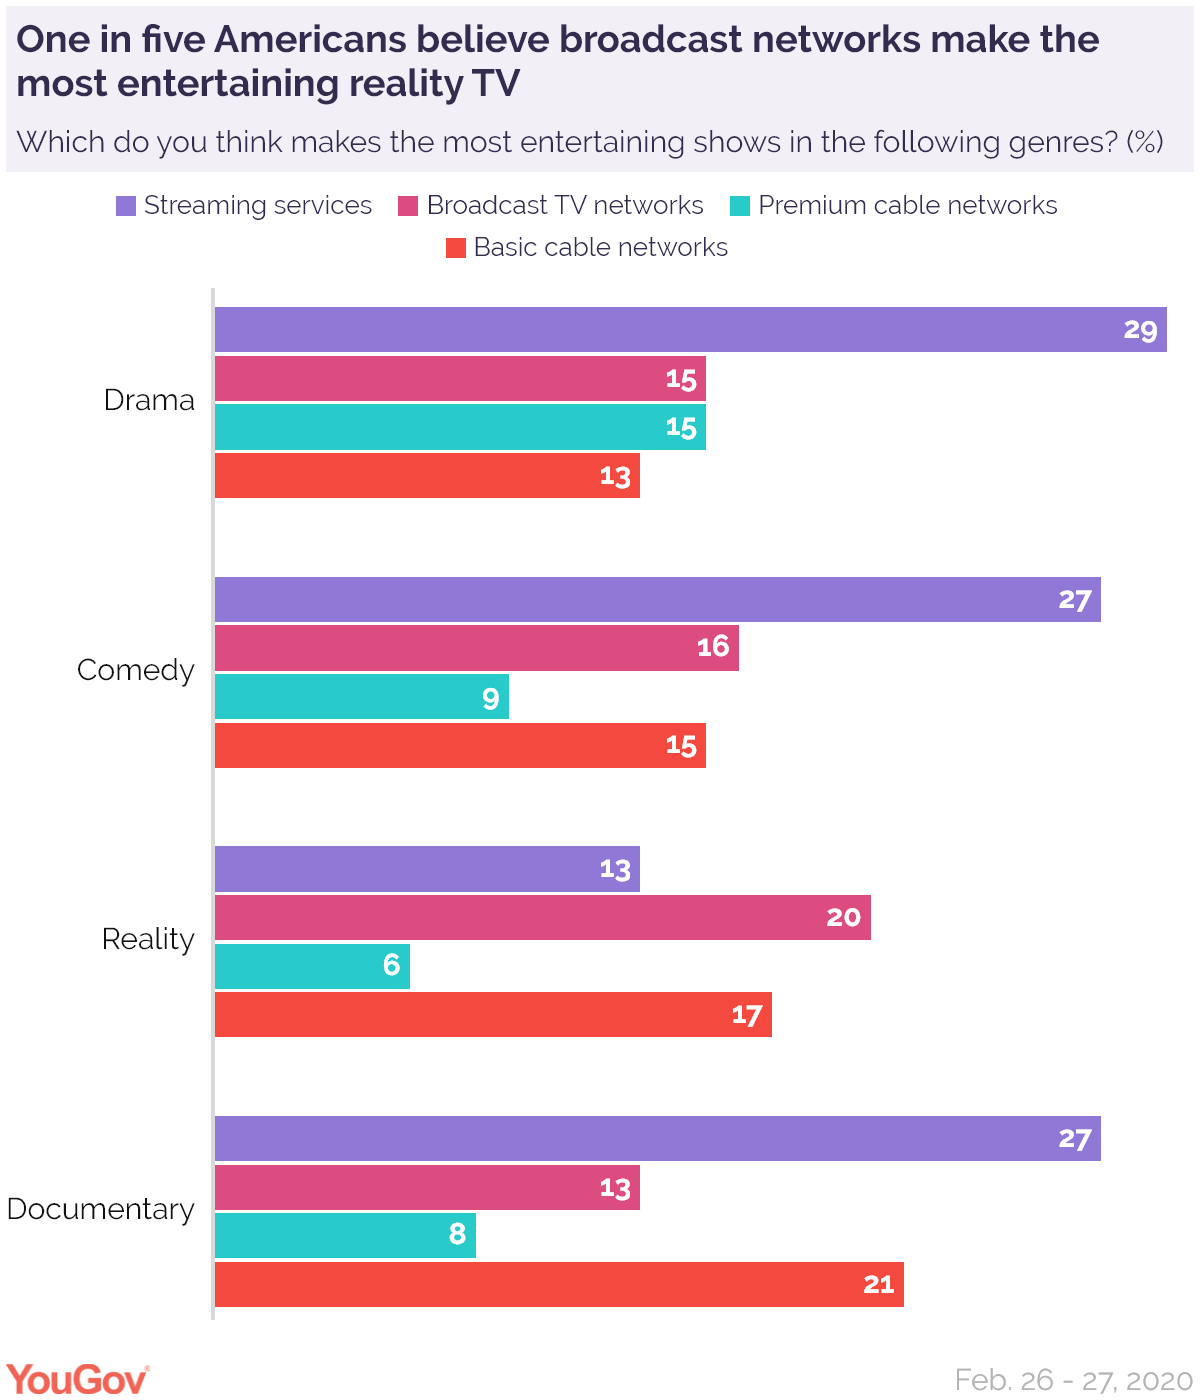
- According to a survey conducted by YouGov and Variety on the best platforms to watch reality TV, 20% of Americans believe that cable TV networks, such as NBC, ABC, FOX CBS, PBS, and The CW, produce the best reality shows. In comparison, 13% of them prefer to watch reality shows on streaming platforms.
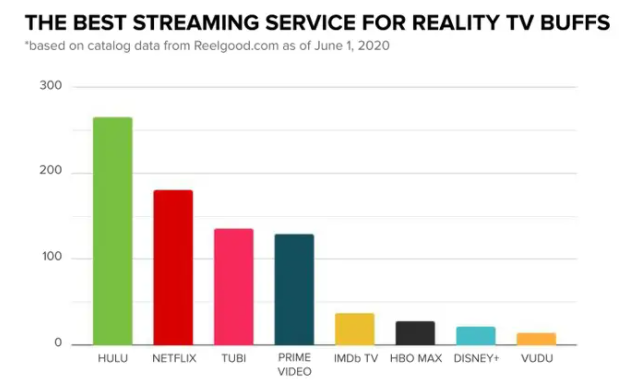
- According to Reelgood's survey in 2020, the most popular streaming platforms to consume reality TV include Hulu (with 265 reality shows), Netflix (180), and Tubi (135). This analysis did not include docuseries. If they are included, Netflix will lead with 383 programs followed closely by Amazon Prime, which has 355.
NOTE: We chose the top platforms depending on consumers' preferability and the number of reality shows they have.
Most Popular Reality TV Shows
- 1. The Amazing Race (2001 – ): It has won 15 Emmys, 26 other wins, and 138 nominations - (Cable: CBS; OTT: Hulu Plus, Paramount+, and Amazon Prime).
- 2. American Idol (2002 – ): The show has won 8 Emmys, 46 other wins, and 144 nominations - (Cable: ABC Network; OTT: Hulu and Live TV).
- 3. The Voice (2011 – ): The show has won 7 Emmys, 31 other wins, and 96 nominations - (Cable: NBC; OTT: YouTube TV, Hulu + Live TV, and Fubo TV).
- 4. Survivor (2000 – ): With 7 Emmys, 31 other wins, and 96 nominations - (Cable: CBAS; OTT: Paramount+ and fuboTV).
- 5. So You Think You Can Dance (2005 – ): The show has won 16 Primetime Emmys, 5 other awards, and 82 nominations - (Cable: FOX; OTT: Hulu and Live TV).
Demographic Analysis Regarding Reality TV Show Consumption in the US
The Percentage of Age Groups Watching Reality TV in the US
The Platforms Audiences Prefer to Watch Reality TV On (Based on Their Demographics)
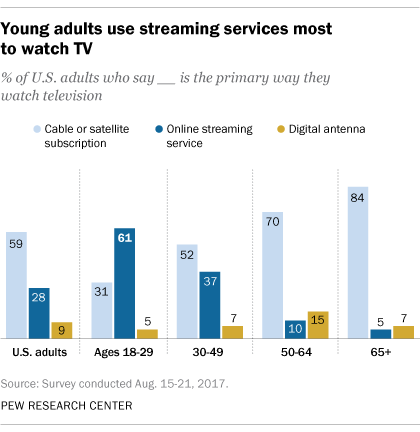
- This information is low in the public domain. However, according to Pew research in 2017:
- 61% and 52% of 18 – 29 and 30 – 49 age groups, respectively, prefer to use OTT platforms to watch TV in the US.
- In contrast, 70% and 84% of age groups 50 – 64 and 64+, respectively, prefer to use cable TV to watch their favorite shows, movies, etc.
- NOTE: Our assumption here is that these figures remain the same when it comes to watching reality TV shows in the US.
Popular Reality TV Genres by Age Group
- The most recent data is not available in the public domain. Therefore, we have provided data from 2016.
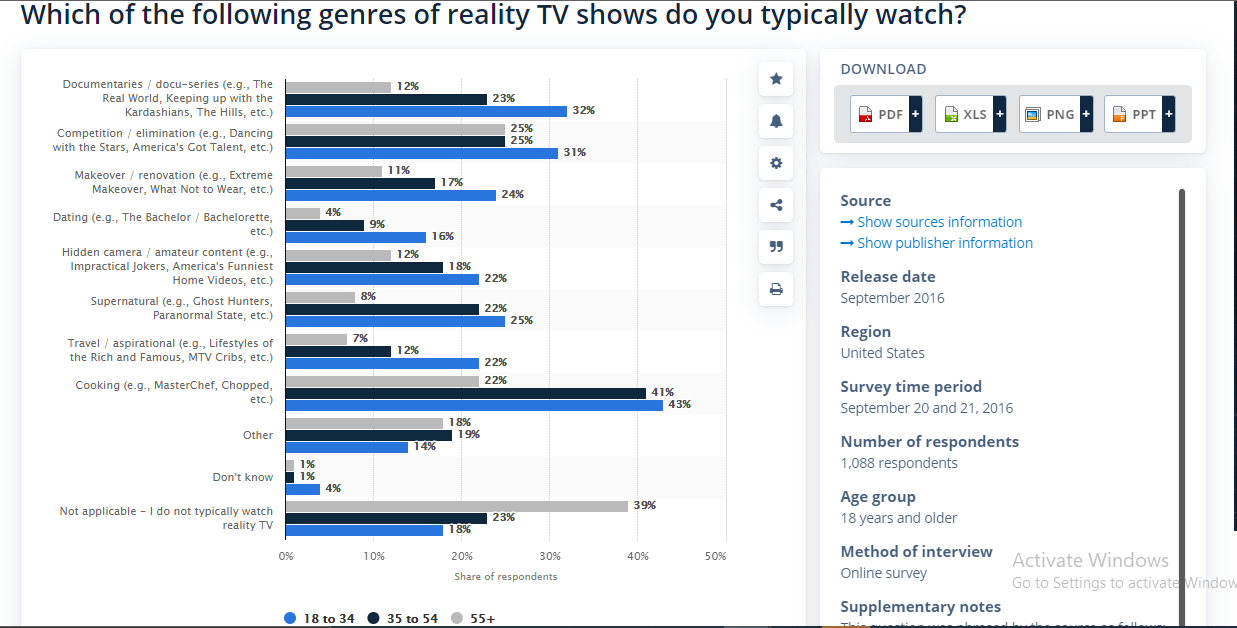
- 1. 41% of the 35 – 54 age group prefer to watch cooking reality shows, such as Master Chef.
- 2. 32% of the 18 – 34 age group prefer to watch documentary reality shows like Keeping up with the Kardashians.
- 3. 25% of both 35 – 54 and 55+ age groups prefer watching competition/elimination reality shows, such as America's Got Talent.
- 4. 24% of the 18 – 34 age group prefer watching makeover/renovation reality shows, like What Not to Wear.
- 5. 22% of the 18 – 34 age group prefer to watch supernatural reality shows, such as Ghost Hunters.
Research Strategy
To find the requested data regarding the cable and OTT reality TV show market in the US, we utilized various reputable sources in the public domain, including 1] News and media articles by Forbes, The New York Times, and others; 2] Industry sources, such as Morning Consult, 3] Reports published by various cable TV networks and OTT companies; 4] Movies and TV shows review sites like Rotten Tomatoes, IMDb; and 5] Sources that provide statistical information, including surveys, such as Statista. From these sources, we could find most of the required data. However, none of them could provide the most recent data about the percentage of shows categorized as reality TV on cable TV networks and OTT platforms and the popular reality TV genres by demographics. In addition, information on where different members of the viewing audience prefer to consume their content based on their demographics was unavailable in the public domain. This could be because there is no recent survey or study in the public domain regarding the 1] percentage of reality shows on various networks and streaming platforms; 2] Popular reality TV genres by demographics, and 3] Platforms audiences prefer to watch reality TV on based on their demographics. Therefore, we have provided the most relevant data regarding the missing information (To achieve this, we had to use data or sources that are more than two years old).
