Part
01
of one
Part
01
Project Tracking Methods
Key Takeaways
- Some effective ways of managing multiple projects include the use of Gantt charts, work breakdown structures, and the agile project management methodology.
- Some effective ways of tracking progress in projects include the use of real-time dashboards, workload reports, and variance reports.
- The variance report shows the difference between what was planned for the project and where the team is in its execution. This allows one to see whether the project is on track or not.
Introduction
We have provided some pieces of information regarding the effective ways of managing multiple projects and tracking progress in each project. We have also provided a description for each piece of information.
Use Gantt Charts for Time and Task Tracking
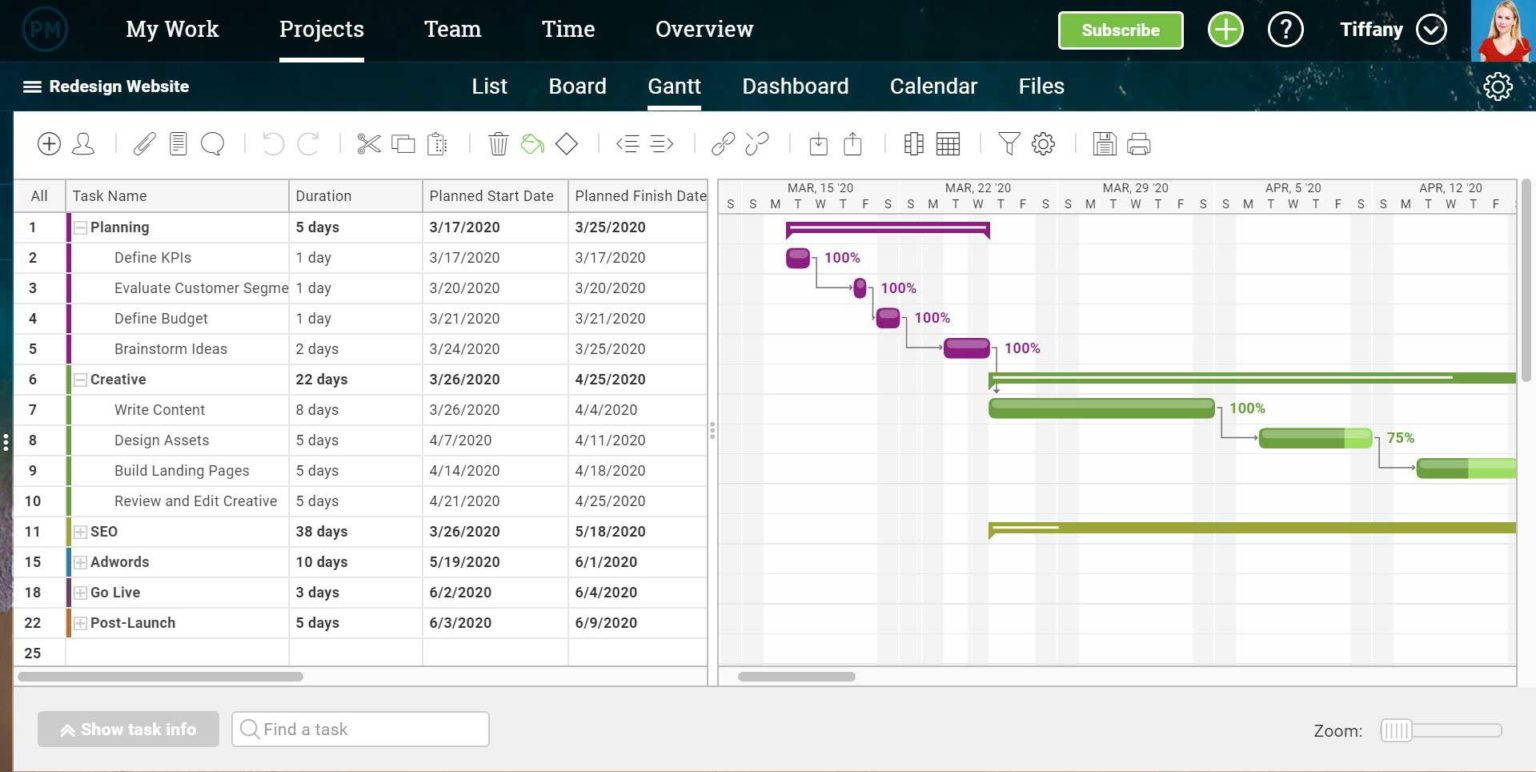
- In order to effectively manage multiple projects and track progress in each project, the use of Gannt charts is necessary. This allows the project team members to have a constant view of "the duration bar that connects the start to the end date of each task."
- This allows the team members to keep themselves in check whether they are working at the right pace in terms of the project's movement. The essential thing about this method is the presence of the "milestone feature to break the project into smaller stages, which also helps track the larger movement of the project."
- A report has also shown that "45% of team members say Gantt charts are their most used project management feature."
- The project manager needs to set milestones or stages throughout the project, and the milestones can be added in Gannt charts to allow team members to track time, tasks, and mark deadlines or important dates. The image below is a sample of a Gantt chart.
Have a Daily Instant Status Report through a Real-time Dashboard
- Having a real-time dashboard that shows an instant status report of the projects being worked on is another effective way of managing multiple projects. One can have this real-time dashboard through the use of project management software.
- It is essential to use project management software since a report has shown that "66% of companies using project management software completed projects within their original budget, compared to 47% of businesses operating without a project management tool."
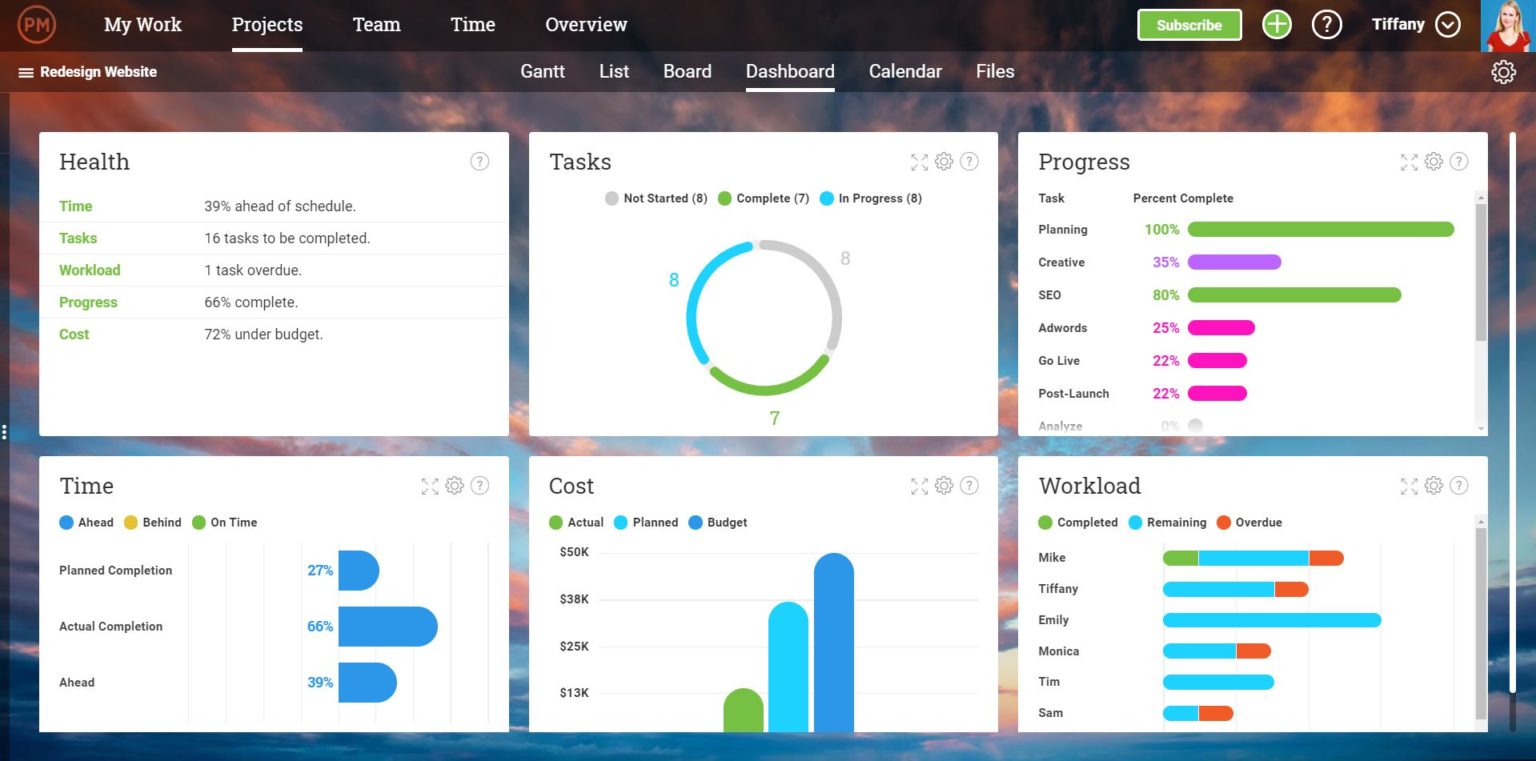
- The dashboard shows graphs and charts of monitored and calculated project key performance indicators that give "a clear view of the overall progress of the project." This is an effective way of managing project data to ensure that problem areas in the project are proactively identified.
- One can also personalize the dashboard depending on the role of the team member. Aside from that, an automatic weekly email that contains a dashboard report can also be sent to project stakeholders for a weekly update.
- Some project performance indicators that one can look at include "the progress of individual tasks, overall project progress, expected time consumed versus actual time, planned versus actual cost and the workload of individual team members." The image below shows different charts of performance indicators.
Use a Work Breakdown Structure to Divide the Project into Manageable Tasks
- Work breakdown structure (WBS) is an organized method "of dividing a project into smaller manageable sections." The WBS chart shows different task hierarchy levels, and level 1 contains the main tasks. The level 1 tasks are then broken down into different sub-tasks.
- The work breakdown structure allows the team to "execute a project in a systematic manner and ensure proper resource allocation." Also, this allows for the formulation of a better project plan, "schedule and assign work, and ensure that project work gets executed systematically." The image below shows a WBS chart.
Use the Agile Project Management Methodology

- The agile project management methodology "involves iterative working in short bursts called sprints." This methodology also allows for time-boxed work, allowing the team to "get as much done as they realistically can before moving to the next set of requirements."
- The time-boxed work of an agile project may also be called an iteration, and each "iteration is usually scheduled to be completed within 2-4 weeks."
- A report has shown that "76% of executives say agile project management tools will be the new normal."
Have a Workload Report and Variance Report
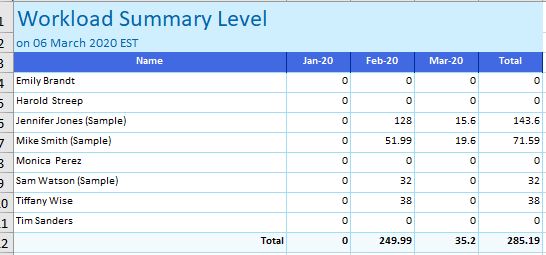
- The workload report shows the number of tasks each team member has been assigned. This report allows one to see whether the workload is balanced or not or whether someone "has too much on their plate" at that instance. This is an effective way of managing a project as it increases productivity and morale. The image below shows a sample of a workload report.
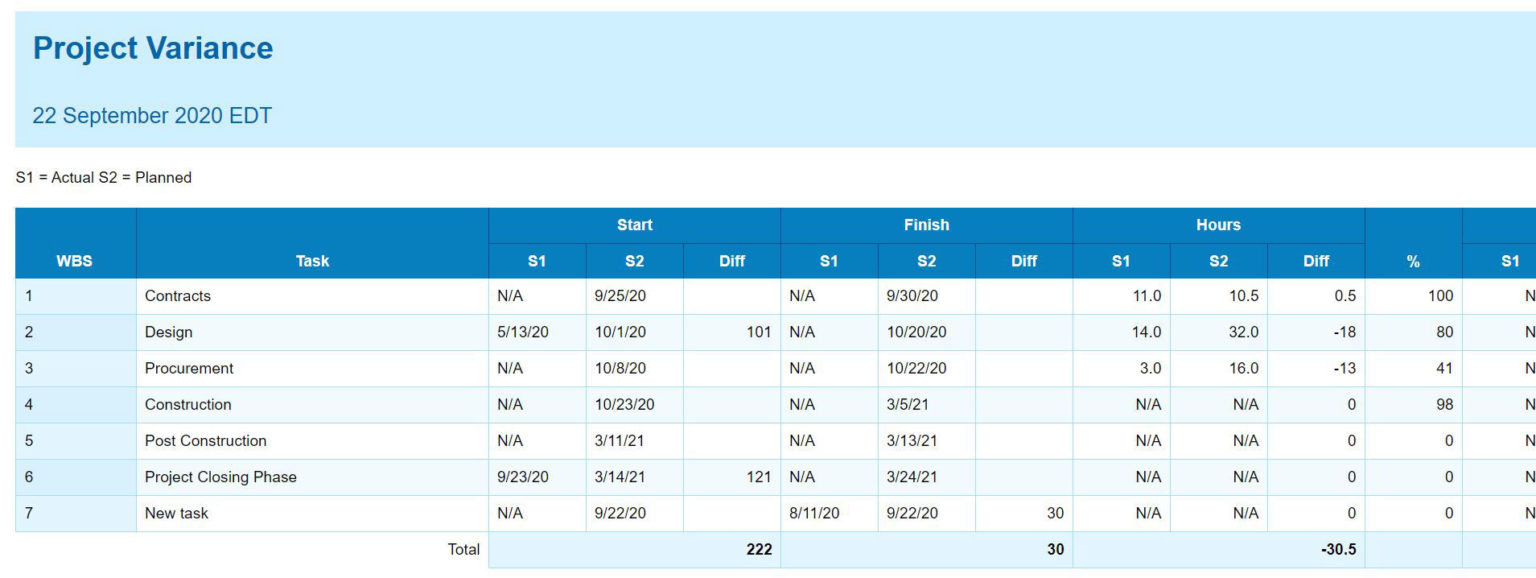
- The variance report, on the other hand, shows the difference between what was planned for the project and where the team is in its execution. This allows one to see whether the project is on track or not. The project data on the current schedule will have to be compared with what was intended at that point in the schedule. The image below shows a sample of a variance report.
Research Strategy
For this research on project management or project progress tracking methods, we leveraged the most reputable sources of information that are available in the public domain, such as Project Manager, Software Advice, and Proof Hub.