Part
01
of one
Part
01
Number of People in the UK in Specific Demographic Groups
Key Takeaways
- The estimated number of people in the UK that fall into the 18-45 age group and household income close to £32k is 5,019,497.
- The estimated number of people in the UK that fall into the ages under 45 and household income of £50k is 2,236,443.
- The estimated number of people in the UK that fall into the ages 35-55 and household income band of £94k is 18,832.
Introduction
Data on the number of people in the UK that fall into the exact age groups and incomes listed was not readily available in the public domain. The numbers of people presented for the three age and household income groups are estimations obtained through triangulation. For consistency, the figures for people across the three age groups were based on the mid-2020 population numbers. More details about data availability and actions taken are provided in the research strategy section.
A summary of the estimated number of people in the UK that fall into the specific age groups and incomes has been provided in the attached spreadsheet. The process for the calculation of estimates in the spreadsheet is comprehensively provided in the report below.
Group 1: Ages: 18-45; Household Income: £32k.
Calculating Percentage of People in Group Ages 18-45
- Statista presents the population of the United Kingdom in mid-2020, by age group. Based on this statistics database, the numbers for various age groups are: 4,133,158 for ages 20-24, 4,476,630 for ages 25-29, 4,521,975 for ages 30-34, 4,404,100 for ages 35-39, and 4,091,543 for ages 40-44. Using these numbers, the total number of people in ages 20-44 as of mid-2020 was calculated as outlined below:
- Figures on Statista regarding the population of the UK 2020, by age, show that, as of 2020, there were 807,777 people aged 45 years, 750,095 aged 19 years, and 717,252 aged 18 years. Using the number of people in ages 20-44 calculated above and the numbers of people aged 18,19, and 45 years, the total number of people in ages 18-45 is calculated as shown below:
- According to the Office for National Statistics, the population of the UK in mid-2020 was about 67,100,000. Based on the total population and the number of people in 18-45 age bracket calculated above, the percentage of the population in this age group is obtained as indicated below:
Calculating the Number of People in Group ages: 18-45; household income: £32k
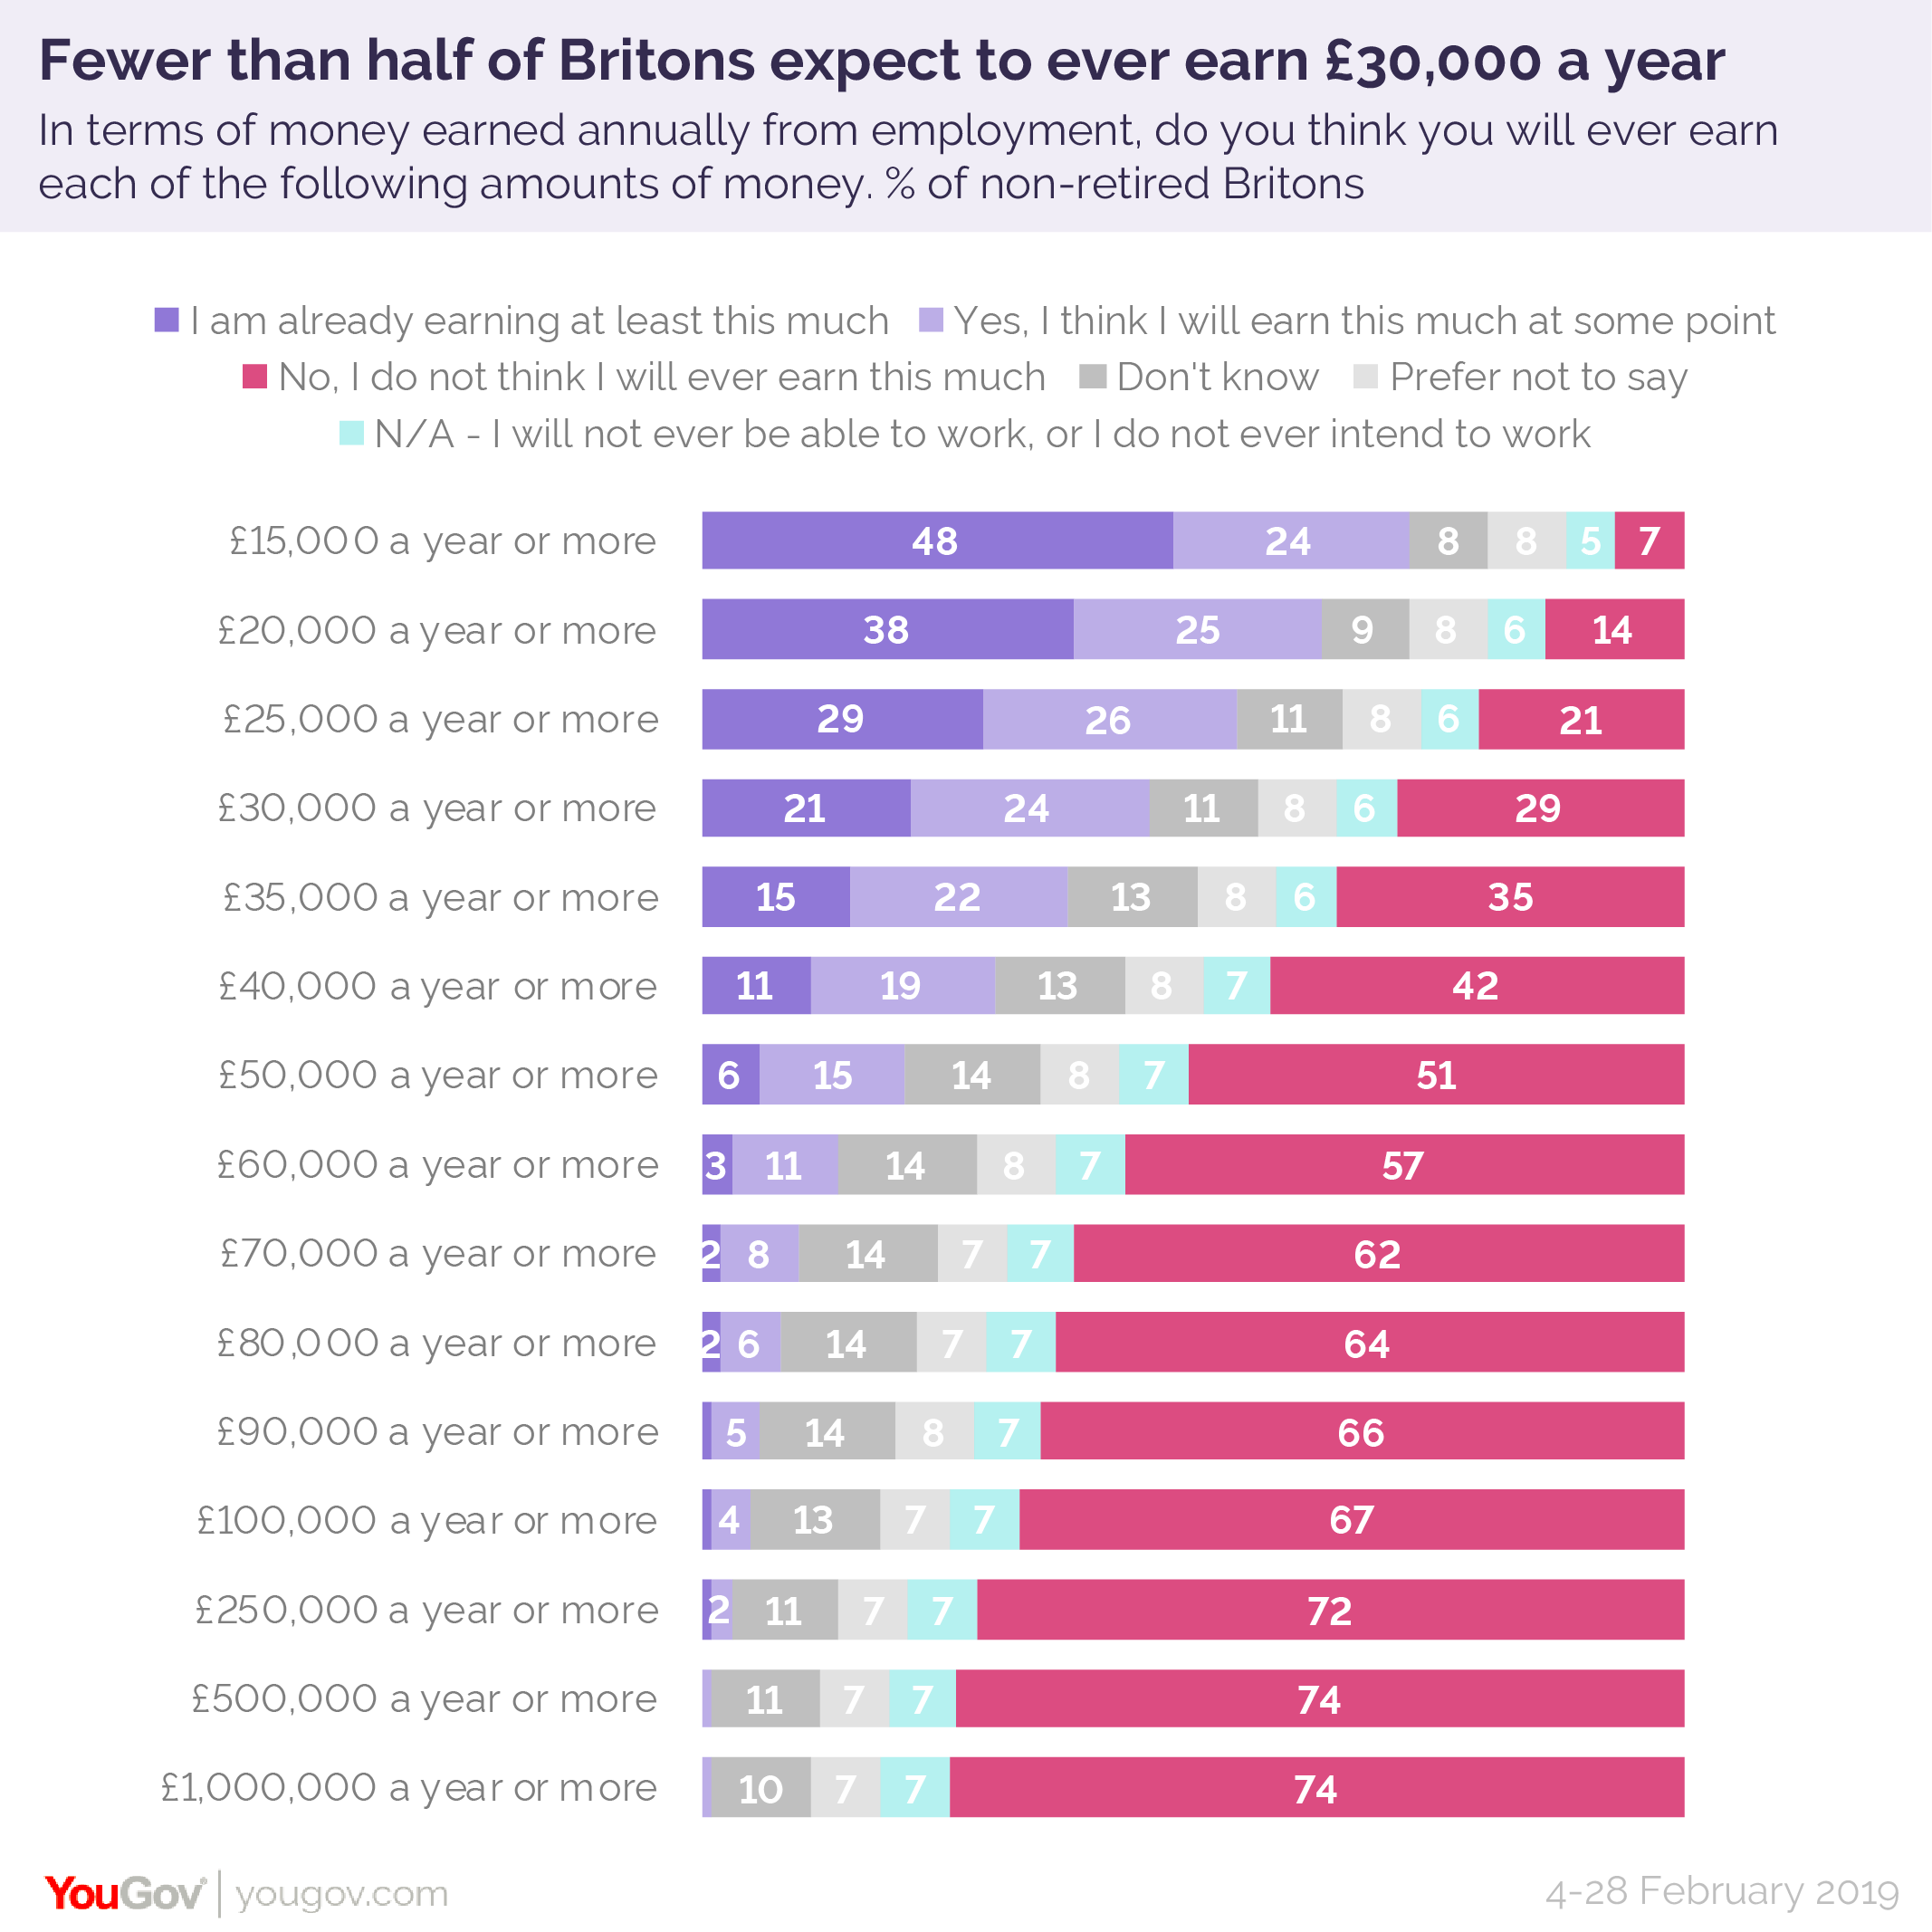
- In the absence of data on the single figure for household income of £32,000, an income of around £30,000 was considered the closest income range. According to the YouGov survey, 21% of people in the UK earn £30,000 a year and more.
- Based on the total population of the UK in mid-2020 stated by the Office for National Statistics as 67,100,000 and the stated percentage of people earning more than £30,000, the number of people in this earning bracket is obtained through triangulation as outlined below:
- According to the report titled “Income Inequality in the UK” by the House of Commons Library, there was a reduction in inequality among people outside the top 1% of individuals based on household income. Thus, the research team assumed a fairly equal distribution of household income amongst people earning around £30,000.
- To calculate the number of people in the 18-45 age bracket with income of around £30,000, we used the percentage of the population in ages 18-45 and the number of people earning at least £30,000; both calculated above. The calculation is as shown below:
- Therefore, he estimated number of people in the UK that fall into the 18-45 age group and household income close to £32k is 5,019,497 (35.622% * 14,091,000).
Group 2: Ages: Under 45, Household Income: £50k.
Calculating Percentage of People in Group Ages 18-45
- According to the statistics on the population of the United Kingdom in mid-2020, by age group, presented by Statista, the numbers of people for various age groups are: 3,782,330 for ages 0-4, 4,137,413 for ages 5-9, 4,045,114 for ages 10-14, 3,683,680 for ages 15-19, 4,133,158 for ages 20-24, 4,476,630 for ages 25-29, 4,521,975 for ages 30-34, 4,404,100 for ages 35-39, and 4,091,543 for ages 40-44. Using these numbers, the total number of people in ages under 45 was calculated as outlined below:
3,782,330 + 4,137,413 + 4,045,114 + 3,683,680 + 4,133,158 + 4,476,630 + 4,521,975 + 4,404,100 + 4,091,543 = 37,275,943
- According to the Office for National Statistics, the population of the UK in mid-2020 was about 67,100,000. Based on this figure for the total population and the above-calculated number of people in ages under 45, the percentage of the population that fall under 45 years is calculated as indicated below:
Calculating the Number of People in the Group Ages 45; Household Income: £50k
- According to the YouGov survey, 6% of individuals in Britain earn £50,000 a year and more.
- Using the total population of the UK in mid-2020 stated by the Office for National Statistics as 67,100,000 and the percentage of people earning more than £50,000, the number of people in the UK in this earning bracket is obtained through triangulation as outlined below:
- To calculate the number of people who fall into ages under 45 and income bracket of £50,000, we assumed a fairly equal distribution of household income and used the percentage of the population under 45 and the number of people earning at least £50,000; both calculated above. This calculation was carried out as shown below:
55.55% * 4,026,000 = 2,236,443
- Hence, the estimated number of people in the UK that fall into the ages under 45 and household income of £50k is 2,236,443 (55.55% * 4,026,000).
Group 3: Ages: 35-55; Household Income: £94k.
- Part of Statista’s breakdown for the population of the UK in mid-2020, by age group is as follows: 4,404,100 for ages 35-39, 4,091,543 for ages 40-44, 4,303,967 for ages 45-49, and 4,616,017 for ages 50-54. Using these numbers, the total number of people in the UK that fall into 35-54 age group was calculated as shown below:
- Statista presents the population of the UK 2020 by age, showing that there were 897,163 people aged 55 years as of 2020. This figure and the above-calculated number of the population in ages 35-54 were used to calculate the number of people in the UK that fall into the ages 35-55 as follows:
- Using 67,100,000 for the population of the UK in mid-2020 as indicated by the Office for National Statistics and the number of people in the UK that fall into the ages 35-55 calculated above, we calculated the percentage of the population in the 35-55 age group as shown below:
- The Office of National Statistics released the average household income in the United Kingdom for the 2019 financial year. According to the figures presented in xlsx format, the number of individuals in the income band of £94,000 is 69,000.
- To calculate the number of people in the UK that fall into ages 35-55 and household income group of £94k, we held matters of equality of distribution constant, and used the above-calculated percentage of the number of people in ages 35-55 and the stated number of individuals in the income band of £94k. The calculation was done as shown below:
- Thus, the estimated number of people in the UK that fall into the ages 35-55 and household income band of £94k is 18,832 (27.292% * 69,000).
Research Strategy
For this research on the number of people in the UK in specific demographic groups, we leveraged the most reputable sources of information that were available in the public domain, including the website, media research reports, databases like Statista, and information from the Office of National Statistics and The Department for Work and Pensions (DWP). We could not find readily available data on the exact age groups and incomes listed in the public domain. Next, the research team used triangulation to estimate the number of people in the UK in the three particular demographic groups. Considering that there were sufficient data points for estimation, we triangulated information across different sources to get estimates for the required numbers. We could not find data specifically touching on the household income of £32k. As necessary, we expanded to incomes closer to £32k and settled for £30,000 because it featured in most sources as the average annual income in the UK. For uniformity and consistency, we used population statistics for mid-2020 for numbers across the three age groups.