Part
01
of one
Part
01
Long-Distance Ride-Sharing Market
Key Takeaways
- It is estimated that the total available market (TAM) size for long distance transportation in the US is $453.32 billion, based on a combination of 2017 and 2019 data.
- It is estimated that the total annual gas cost for long distance travel by personal vehicle in the US is between $68.547 billion and $107.135 billion. These estimates were based on data from 2017, 2019, 2021, and 2022 gas prices.
- It is estimated that the total annual spending on train fares for long distance travel in the US is $195.7 million. This is based on data from 2017.
- It is estimated that the total cost for bus fares for long distance travel in the US is between $2.925 billion and $5.850 billion.
Introduction
Provided below are triangulations for the total addressable market (TAM) size of long distance trips in the US, the total cost of gas per year for long distance trips, the total annual cost of train fares for long distance trips, and some helpful findings on long distance trips by bus and ride sharing. As there were few details in the request that indicated exactly what should be included in the TAM calculation (for example, should food and lodging costs be included in the cost), the data provided was led by the research, and all assumptions have been fully explained.
While it was not possible to provide a breakdown of the TAM based on different modes of transportation, publicly available data did allow for triangulations of helpful findings related to personal vehicle and train travel. Due to a lack of data on long distance travel by bus and through ride sharing, some helpful findings have been provided in each of those sections, rather than an estimated TAM.
All calculations used in the triangulations, as well as any assumptions made, are shown in the relevant sections. A full description of the logic used can be found in the Research Strategy at the end of the report.
TAM Size Long Distance Trips
- It is estimated that the TAM size for long distance transportation in the US is $453.32 billion, based on a combination of 2017 and 2019 data.
- Following is the data, assumptions, and calculations used to triangulate the above total addressable market (TAM) size of the long distance trip segment of the personal transportation industry in the US.
- In 2020, Americans spent $1.2 trillion on transportation expenses. However, this was a decrease of 13.7% from 2019, which had total spending on transportation of $1.4 trillion. Since 2019 was the last year with data not impacted by the pandemic, that number is used in the calculations that follow.
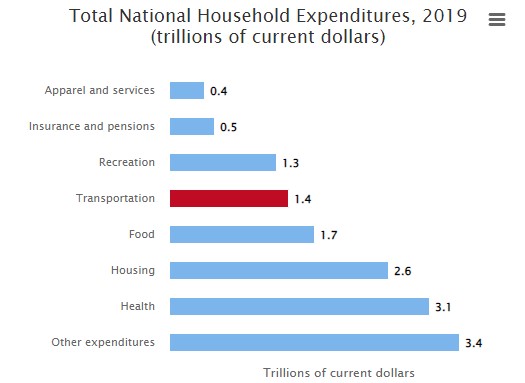
- As defined by the Bureau of Transportation Statistics, transportation expenditures include "spending on durable goods, such as vehicles; nondurable goods, such as fuel; and services, such as for-hire transportation. It includes spending by governments, employers, and other organizations on behalf of households—for example, employee transit subsidies."
- According to data published in 2017, which was based on a national survey, Americans travel 11 billion miles per day, so the total miles per year are 4.015 trillion [11 billion (miles per day) * 365 (days per year)].
- Based on the same survey, Americans reported traveling 1.3 trillion miles for long distance travel (defined as travel over 50 miles).
- Using the previous two data points it is estimated that 32.38% [1.3 trillion (total long distance miles)/4.015 trillion (total miles)*100] of miles can be attributed to long distance travel.
- By assuming that the amount spent on long distance travel is in proportion to the miles traveled for long distance, it can be estimated that the total spending on long distance transportation is $453.32 billion [$1.4 trillion (total household spending on transportation in 2020) * 32.38% (percent of total miles attributed to long distance)].
- Limitations on the above estimate
- There are many costs associated with long distance trips such as transportation expenses, food, lodging, and entertainment. The above estimate only accounts for transportation expenses.
- Based on data availability it was assumed that the amount spent on long distance travel was in proportion to the percentage of long distance miles compared to total miles. In reality, there was no data found publicly available that indicated whether long distance travel was more expensive, less expensive, or the same as shorter travels. Therefore, that is not a data-backed assumption, and was made as a logical assumption to allow the research to move forward.
- While the data on miles traveled was based on information published in 2017, the total transportation expenditure was based on 2019 data. There was no information found that would allow for an estimate of 2019 travel miles.
Breakdowns
- As with the TAM size for long distance travel in the US, the breakdown of the market size by various modes of transportation was not found in the public domain. However, some estimates were made based on data that was available.
- It is estimated that the total annual gas cost for long distance travel by personal vehicle in the US is between $68.547 billion and $107.135 billion. These estimates were based on data from 2017, 2019, 2021, and 2022.
- Following is the data, assumptions, and calculations used to triangulate the above estimates for the total gas cost for long distance travel by personal vehicle in the US.
- Based on current data from AAA, the average cost of gas in the US ranges from $3.77 to $5.88 per gallon.
- The EPA reported that for 2019, the average miles per gallon for US vehicles was 24.9 mpg.
- In 2021, it was reported that the typical fuel tank size is 15 gallons.
- A fill up costs between $56.55 ($3.77*15) and $88.20 ($5.88*15).
- The gas cost per mile driven can be estimated to be between $0.151 [$56.55 (cost for low end fill up)/24.9 (average mpg)*15 (typical fuel tank size)] and $0.236 [$88.20 (cost for high end fill up)/24.9 (average mpg)*15 (typical fuel tank size)].
- There are 2.6 billion long distance trips in the US each year, and 90% of those happen in a personal vehicle. Therefore, it is estimated that there are 2.34 billion trips by personal vehicle [2.6 billion (total long distance trips) * 90% (trips by car)].
- The average length of a long distance trip in a personal vehicle is 194 miles. So the total long distance miles traveled by personal vehicle is 453.96 billion miles [2.34 billion (trips by personal vehicle) * 194 (average length of long distance trip in a personal vehicle)].
- Finally, the total gas cost for long distance travel by personal vehicle in the US is between $68.547 billion [453.96 billion (total miles) * 0.151 (low cost per mile)] and $107.135 billion [453.96 billion (total miles) * 0.236 (high cost per mile)].
- It is estimated that the total annual spending on train fares for long distance travel in the US is $195.7 million. This is based on data from 2017.
- Following is the data, assumptions, and calculations used to triangulate the above estimate for total spending on train fares for long distance travel in the US.
- There are a total of 2.6 billion long distance trips in the US each year, and 1% of those are by train. Therefore, it is estimated that 26 million [2.6 billion (total long distance trips) * 1% (trips by train)] long distance trips occur by train.
- The average length of a long distance trip by train is 192 miles. So the total long distance miles traveled by train is 4.992 billion miles [26 million (trips by train) * 192 (average length of long distance trip by train)].
- The average fare per mile on Amtrak in 2017 was $0.392. This includes passenger payments and government subsidies. This fare is being used as a proxy for the overall average train fare per mile.
- The total spent for long distance train travel in the US can be estimated as $195.7 million [4.992 billion (total long distance miles traveled by train) * $0.392 (average fare per mile proxy)].
- Approximately 2% of long distance trips in the US happen by bus. This would be a total of about 52 million trips [2.6 billion (total long distance trips) * 2% (trips by bus)].
- With the average long distance bus trip being 287 miles, it is estimated that the total long distance miles traveled by bus is 14.924 billion miles [52 million (trips by train) * 287 (average length of long distance trip by bus)].
- There was no publicly available data on the fare per mile for bus travel. One source reported that "train tickets are usually significantly more expensive than bus tickets. Sometimes up to twice the price." However, we couldn't find any data to support this claim.
- If it is assumed that bus fares per mile are equal to train fares, the total cost could be estimated as $5.850 billion [14.924 billion (total long distance miles traveled by bus) * $0.392 (average fare per mile proxy)].
- If it is assumed that bus fares per mile are half as much as the train fares, the total cost could be estimated as $2.925 billion [14.924 billion (total long distance miles traveled by bus) * $0.392/2 (average fare per mile proxy)].
- Under those broad assumptions, it is estimated that the total cost for bus fares for long distance travel in the US is between $2.925 billion and $5.850 billion.
- McKinsey reported in 2017 that ridesharing accounted for 1% of the total vehicle miles traveled in the US. While more recent data on specific urban areas was found, there was no way to use those numbers to provide a country-wide estimate.
- Ridester estimates the average cost per mile for Uber is $1-$2.
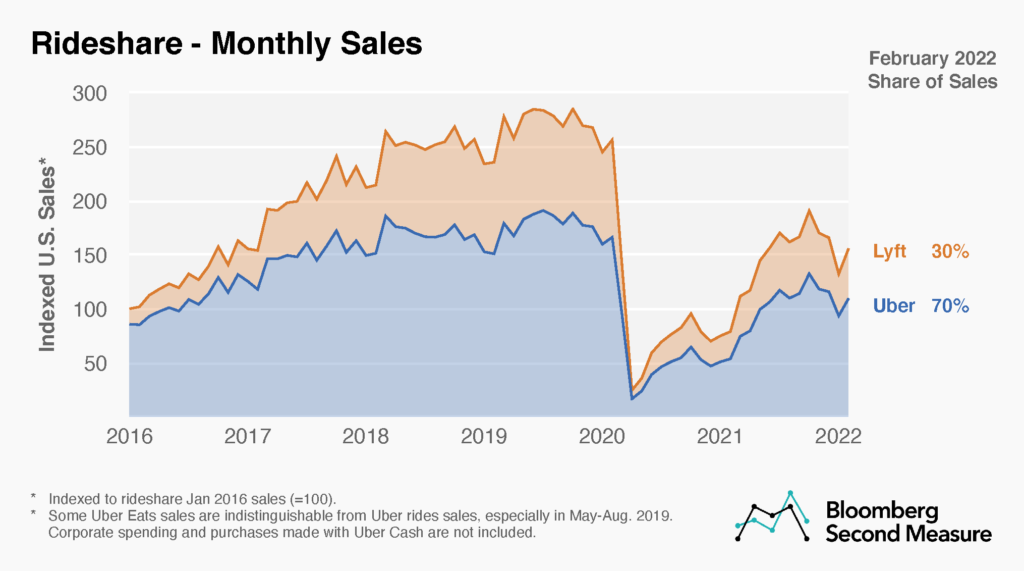
- Uber and Lyft account for almost 100% of the US rideshare market. Their sales by year can be seen in the chart below.
- One traveler used Uber to travel from North Carolina to California, a total of 2,256 miles. The cost of the trip was $5,500. If this is an indication of typical costs, it seems unlikely this would be a popular choice!
Total Cost of Gas for Long Distance Personal Vehicle Trips in the US
Total Cost for Train Fares for Long Distance Travel in the US
Total Cost for Bus Fares for Long Distance Travel in the US
Rideshare
Research Strategy
For this research on TAM size for long distance trips in the US, we leveraged the most reputable sources of information that were available in the public domain, including the Bureau of Transportation Statistics, AAA, and the Urban Reform Institute. Ultimately, the TAM needed to be estimated as it was not available in the public domain.
There was no data found in the public domain that would allow for an estimate of the money spent on long distance travel by ridesharing in the US. After finding data that gave a range of the cost per mile for Uber, which could be used as a proxy for the industry overall, we attempted to find data on the total miles traveled by ridesharing vehicles. With this data and data on the percentage of miles that were attributed to trips of 50 miles or more, we could provide an estimate of the total cost of fares for long distance ridesharing in the US. Unfortunately, while we did find information on the total vehicle miles traveled by ridesharing vehicles, data on the percentage of miles attributable to long distance trips was not available in the public domain. Several reputable sources were utilized to locate the needed data, including the Transport Policy journal, Mordor Intelligence, and Fortune Business Insights.
A major assumption that was made for this research was that the TAM size for long distance travel should only include amounts directly related to travel. This assumption was made because the data that was found allowed for estimates to be made based on travel costs only. There are typically other costs associated with long term travel, such as food and lodging, that were not included or considered.
Another assumption that was used, and was determined by the data available, was that long distance travel should be defined as travel of 50 miles or more.