Part
01
of one
Part
01
Indoor Arenas and Circuits: Size and CAPEX Analysis (2)
Key Takeaways
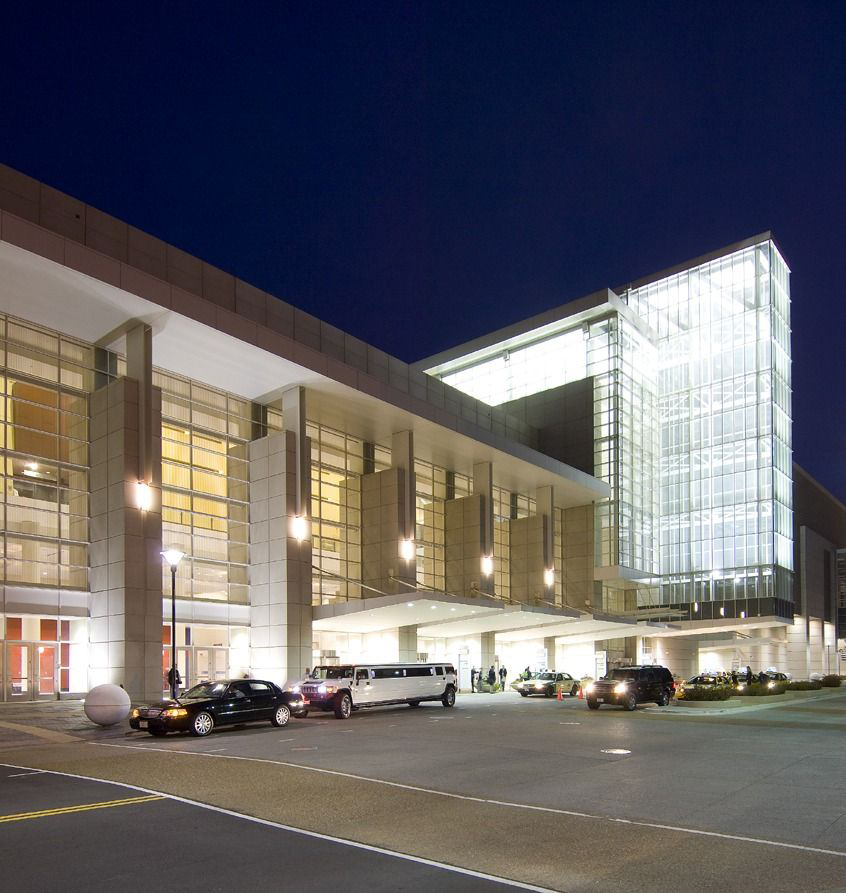
- McCormick Place in Chicago has a combined area of 2.6 million square feet (241,547 square meters, considering the conversion factor of 1 square foot = 0.0929 square meters). The original McCormick Place that opened in 1960 had a CAPEX of US$35 million. The CAPEX of the expanded McCormick Place that opened in 2008 was US$850 million.
- The Belmont Park horse racing circuit in New York City has a track length of 1.5 miles. The cost required to build the original Belmont Track in 1905 was US$2.1 million. Plans to build a completely new Belmont Park starting in 2023 involves a projected CAPEX of US$1 billion.
- Dr. Phillips Center for the Performing Arts in Orlando, USA, comprises three theaters: Walt Disney Theater (2,734 seats), Steinmetz Hall (1,764 seats), and Alexis & Jim Pugh Theater (294 seats). Hence, the sum total seating capacity of Dr. Phillips Center for the Performing Arts is 4,792 seats.
Introduction
The research brief has identified, verified, and corrected the capacity size and CAPEX of 39 T1, T2, and T3 indoor arenas and circuits. The capacity size and CAPEX and their respective sources have been populated in columns I-O of the purple and yellow highlighted cells in rows 15-69 of the 'Raw Benchmarks' tab of the attached Google spreadsheet. However, the individual CAPEX for certain indoor arenas (like the Coca Cola Arena in the UAE) and gun shooting ranges (like the C2 Tactical Range, P2K Range, Paintball Parc Pomponne, and Paintball Dubai) are not available in the public domain. Additionally, the research failed to identify any shooting range called Battlefront whose online footprint exists. Hence, for such cases, 'N/A' has been populated in the corresponding cells of the spreadsheet and explanatory comments have been provided in column O. Furthermore, a few indoor arenas and circuits are part of larger developmental projects and the concerned development authorities have only disclosed the CAPEX of these larger developmental projects OR they had been constructed in a phased manner and the CAPEX for all phases are not available. These instances have been treated suitably within the spreadsheet. Selected findings from the spreadsheet and the research strategy utilized to find the requested information are presented below.
The requested details have been populated within the purple and yellow highlighted cells of the project spreadsheet that can be accessed here.
Selected Findings
- McCormick Place in Chicago has a combined area of 2.6 million square feet (241,547 square meters, considering the conversion factor of 1 square foot = 0.0929 square meters). The original McCormick Place that opened in 1960 had a CAPEX of US$35 million. The CAPEX of the expanded McCormick Place that opened in 2008 was US$850 million. [Calculation: 2.6 million * 0.0929 square meters = 241,547 square meters]
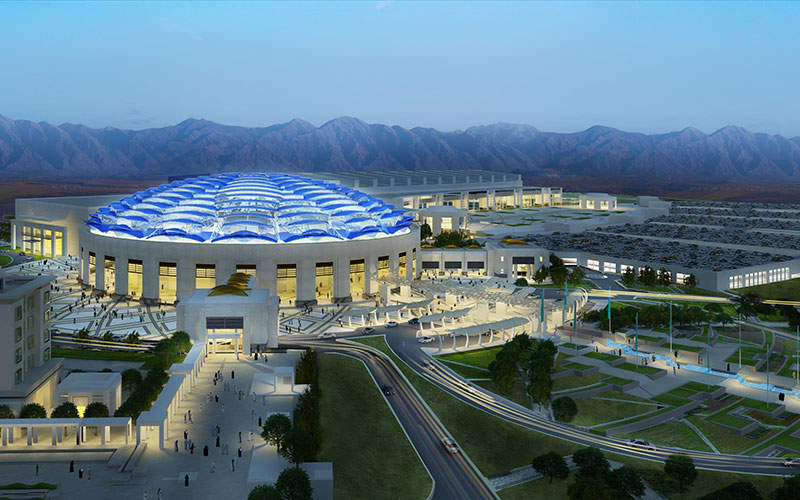
- Oman Convention & Exhibition Centre has an area of over 100,000 square meters. The facility was constructed for approximately US$1.5 billion.
- The Belmont Park horse racing circuit in New York City has a track length of 1.5 miles. The cost required to build the original Belmont Track in 1905 was US$2.1 million. Plans to build a completely new Belmont Park starting in 2023 involves a projected CAPEX of US$1 billion.
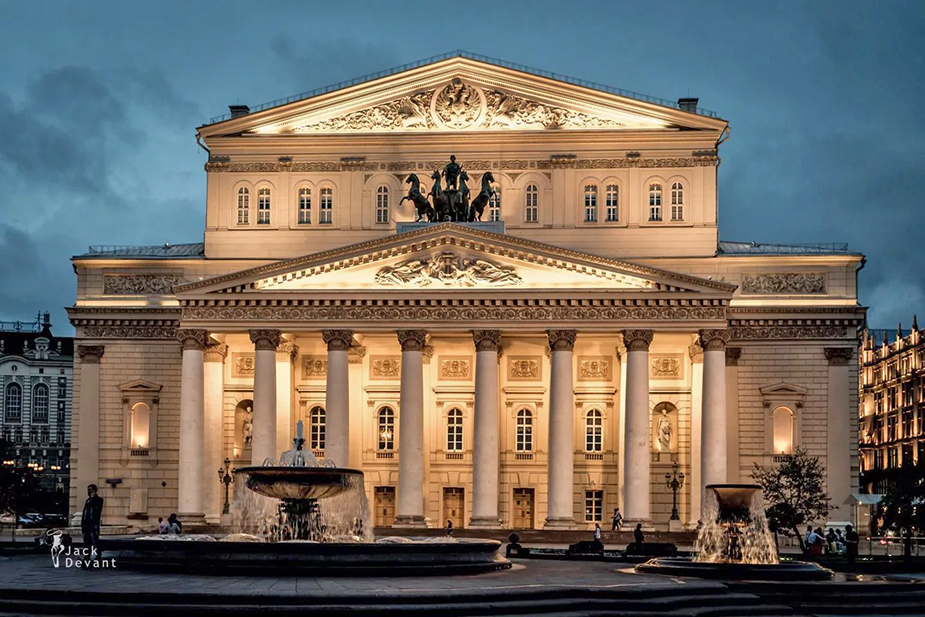
- The Bolshoi Theater in Moscow can currently seat 2,153 spectators. Since the history of the Bolshoi Theater is confusing with two different dates of opening, the original CAPEX is not available in the public domain. However, an extensive six-year renovation of the Bolshoi Theater cost 21 billion rubles (US$688 million).
- Dr. Phillips Center for the Performing Arts in Orlando, USA, comprises three theaters: Walt Disney Theater (2,734 seats), Steinmetz Hall (1,764 seats), and Alexis & Jim Pugh Theater (294 seats). Hence, the sum total seating capacity of Dr. Phillips Center for the Performing Arts is 4,792 seats. [Calculation: 2,734 seats + 1,764 seats + 294 seats = 4,792 seats]
Research Strategy
To identify, verify, and correct the capacity size and CAPEX of 39 T1, T2, and T3 indoor arenas and circuits mentioned within the purple and yellow highlighted cells in rows 15-69 of the 'Raw Benchmarks' tab of the attached Google spreadsheet, we have leveraged the most reputable sources of information in the public domain, including the websites of the arenas and circuits. We also leveraged several news articles from reputable 3rd-party news publications like The Daily Telegraph, Arabian Business, The National, Forbes, Business Insider, and CNN, among others. Furthermore, we also leveraged case studies by sources like Buro Happold, Dar, Virtuosity Blog, and Propsearch LLC and articles by construction industry sources like Construction Week Online and ME Construction News, among others. However, despite a comprehensive search of the public domain, including all the above mentioned sources, we were unable to identify the individual CAPEX for certain indoor arenas (like the Coca Cola Arena in the UAE) and gun shooting ranges (like the C2 Tactical Range, P2K Range, Paintball Parc Pomponne, and Paintball Dubai). One possible reason could be that most shooting ranges are privately-held, hence they are not obligated to disclose their CAPEX or capacity figures in the public domain. Additionally, the research failed to identify any shooting range called Battlefront whose online footprint exists. Hence, for such cases, 'N/A' has been populated in the corresponding cells of the spreadsheet and explanatory comments have been provided in column O. Furthermore, a few indoor arenas and circuits are part of larger developmental projects and the concerned development authorities have only disclosed the CAPEX of these larger developmental projects OR they had been constructed in a phased manner and the CAPEX for all phases are not available. These instances have been treated suitably within the spreadsheet and useful information has been provided as comments in column O.
The meaning of the color codes and highlights within the assigned areas of the spreadsheet are as follows:
- Hyperlinked data within the purple highlighted cells: The data within these cells has been changed/corrected from the ones provided.
- Non-hyperlinked data within the purple highlighted cells: The data within these cells has been verified and not changed/corrected from the ones provided.
- Data presented in red font within the purple highlighted cells: Since the CAPEX figures for these indoor centers and arenas could not be found in the public domain, the data provided within these cells could not be verified.
- Yellow highlighted cells: All data within these cells have been provided (except in column K whose K SAR equivalents were not publicly available or which were not provided with the spreadsheet itself).
The following conversion factors have been utilized in our calculations:
- USD to SAR exchange rate: 3.75 (As mentioned in the spreadsheet)
- AUD to SAR exchange rate: 2.43 (As mentioned in the spreadsheet)
- GBP to SAR exchange rate: 4.78 (As mentioned in the spreadsheet)
- CHF to SAR exchange rate: 4.28 (As mentioned in the spreadsheet)
- EUR to SAR exchange rate: 4.1 (As mentioned in the spreadsheet)
Considering the nature of the research and the requirement for finding historical CAPEX values, dated sources older than the standard Wonder timeline of 24 months have been utilized to complete the research.


