Part
01
of one
Part
01
Adult Sports Participation and Spend
Key Takeaways
- Some adult sports with increasing participation include surfing, kayaking, basketball, climbing, cycling, running, snow sports, golf, and tennis.
- While spending on most sports depends largely on the engagement level of the participant (i.e., casual, frequent, competitive), some higher-investment sports (that may also appeal to higher-income consumers) include climbing (upwards of $3,000 annual spend), scuba diving ($1,000-$6,000 annual spend), mountain biking, snow sports (up to $10,000+ spend for some), triathlon, tennis, and golf.
- Frequent sports participants generally represent a minority in terms of adult sports participants (e.g., 27% of scuba divers are considered "core", while 36% of pickleball players are considered "core." However, these participants drive spending and may account for the majority of sports occasions.
Introduction
The research below highlights 14 adult sports, focusing on quantitative and qualitative insights associated with participation, including metrics such as spending, frequency of participation, participation numbers and growth, and demographics. Because the availability of metrics varied across sources focused on each sport, specific details provided may vary somewhat between sports. Relevant early research findings were also incorporated into the full research as needed.
Surfing: Increased Popularity and Frequency
- A 2021 survey by the Sports and Fitness Industry Association (SFIA) highlights surfing as a sport that experienced strong growth in popularity (number of participants) and frequency of "core" participation (participants who did the activity frequently).
- ActionWatch, which collects data for surf shops and brands in the United States, reported a 113% growth in surf hardgoods (surfboards, leashes, fins) in June 2020, with continual growth since. The pandemic drove some of this growth as kids and adult learners turned to surfing as a "fun, socially distant exercise."
- In 2017, there were 2.68 million — 3.3 million surfers in the US, with the typical profile of a surfer being a male, aged 34, earning over $75,000 per year. At that time, initial startup costs were $640.
- The average surfer in 2017 participated 108 times per year, at a cost of $50-$100 per session. ($5000-$10,800 per year).
- An alternative cost breakdown from early research includes between $400 to over $1,000 for a surfboard, $125-$350 for a wetsuit, between $20 to $70 an hour for lessons, and $600 to $700 for additional gear (total cost over $2,000, depending on overall involvement).
Masters Swimming Attracts Competitive and Non-Competitive Adults
- United States Masters Swimming (USMS) describes itself as the "best-organized sport for adults," with 65,000 participants across 1,500 clubs. Masters swimmers are generally fitness swimmers, competitive swimmers, triathletes, or open water swimmers.
- USMS notes that 9 million Americans are fitness swimmers, most of whom do not belong to an organized program.
- USMS notes the amount of time spent by masters swimmers can vary from once a week to seven times a week, depending on factors such as age, genetics, lifestyle and nutrition factors, and attitude/motivation.
- Masters swimming is generally not a high-spend sport, with registration fees ranging from $12 (local fee) to $48 (national fee) for an organized program. Club fees for masters swimmers will range by region, with higher-priced programs (such as that offered by Chelsea Piers Connecticut) from $30-$60/month ($360-$720 per year).
- SFIA found that aquatic exercise declined in popularity and participation frequency in 2020, but this was likely due in part to limited access to pools during the pandemic.
Basketball: Elevated Popularity and Consistent Frequency of Participation
- In 2020, basketball participation increased 11.4% overall and 3.6% among "core" (frequent) participants. Since 2015, total participation has increased by 18.6%.
- Basketball has a relatively low cost of entry, requiring limited equipment and a relatively easy setup (indoor or outdoor). Participation rates are high, with the International Basketball Federation (FIBA) noting 450 million participants (or spectators) globally.
- A slightly older (2012) but relevant statistic provided by the Sporting Goods Manufacturers Association found that of the total population of basketball players, 28% were 18-24, while 24% were over 35.
Indoor and Outdoor Climbing Growing
- According to the Climbing Business Journal, the commercial climbing industry grew 6.8% in 2016, 10% in 2017, and 11.8% in 2018. Its popularity is also reflected in the decision to include the sport in the Tokyo Olympic Games.
- A 2019 report found that 65% of climbers are between 18 and 35 years of age. Indoor climbers account for just over half of climbers (52%).
- Climbing accounted for an estimated contribution of $12.5 billion to the economy as of 2019, with most of the contribution driven by travel (87%).
- Typical costs for indoor climbing range from $10-$15 per session and $175 for climbing shoes. Outdoor climbing is slightly more pricey, with equipment expenditures estimated at $500. For more "extreme enthusiasts" costs can increase to $3,000 per climber, which includes equipment, instruction, permits, and insurance.
- On average, 3 days per week for an intense indoor climb is considered appropriate to allow for recovery (156 days per year).
Scuba Diving a High Investment Activity
- Annual activity costs for a scuba diver range from $1,000 for a casual scuba diver to $6,000 for a more serious scuba diver.
- Casual scuba divers tend to participate less frequently (for example, on vacation), with costs covering travel, rental gear, and insurance. SFIA defines casual scuba diving as participating in a dive 1-7 times per year.
- More experienced divers must cover advanced training and potentially even certification, as well as equipment, travel, and insurance. This Nerdwallet article suggests an advanced diver may average 5 occasions per year (though certification may require 50 or more dives). SFIA defines experienced, frequent diving as 8+ times per year.
- In 2020, there were 2.59 million US scuba divers, most of whom (73%) are casual divers.
- The sport is declining among casual divers, with the participation of these athletes decreasing 4.8% annually over five years. Participation among "core" divers declined 4.0% annually over the same period, but increased 1.3% in the most recent year, driven by a trend toward outdoor activity.
Pickleball a Growing Adult Team Sport
- Pickleball participation grew 21.3% in 2020, with participation among "core" pickleball players increasing 8.9%. Since 2019, participation has grown 67.3%.
- According to SFIA, there were an estimated 3.46 million pickleball players in the US in 2020, with 2.2 million (64%) considered casual players (playing 1-7 times per year) and the remaining 36% classified as "core" players (playing 8+ times per year).
- The average player is male (62%) and 43.5 years of age. Core players are slightly older (average age 51.5 years).
- Pickleball is relatively inexpensive and requires minimal gear, which may expand its reach to a broader population and has contributed to its growth. Equipment for a beginner may be as low as $30, while more advanced players may opt for more sophisticated equipment ($100+). Games are generally played on retrofitted tennis courts, which keeps costs low.
Participation Growing Among Frequent and New Cycling Participants
- In 2020, core participation in cycling increased 11.6% (12.9% overall).
- A 2019 Outdoor Sports survey found road biking, mountain biking, or BMX, the third most popular outdoor sport, with 15.9% of Americans (47.9 million participants) engaging in the sport.
- Frequent young adult (18-24) participants reported an average of 43.2 annual outings.
- During the COVID pandemic, 10% of cyclists either starting riding or tried riding in a new way (e.g., indoor riding or riding for transportation).
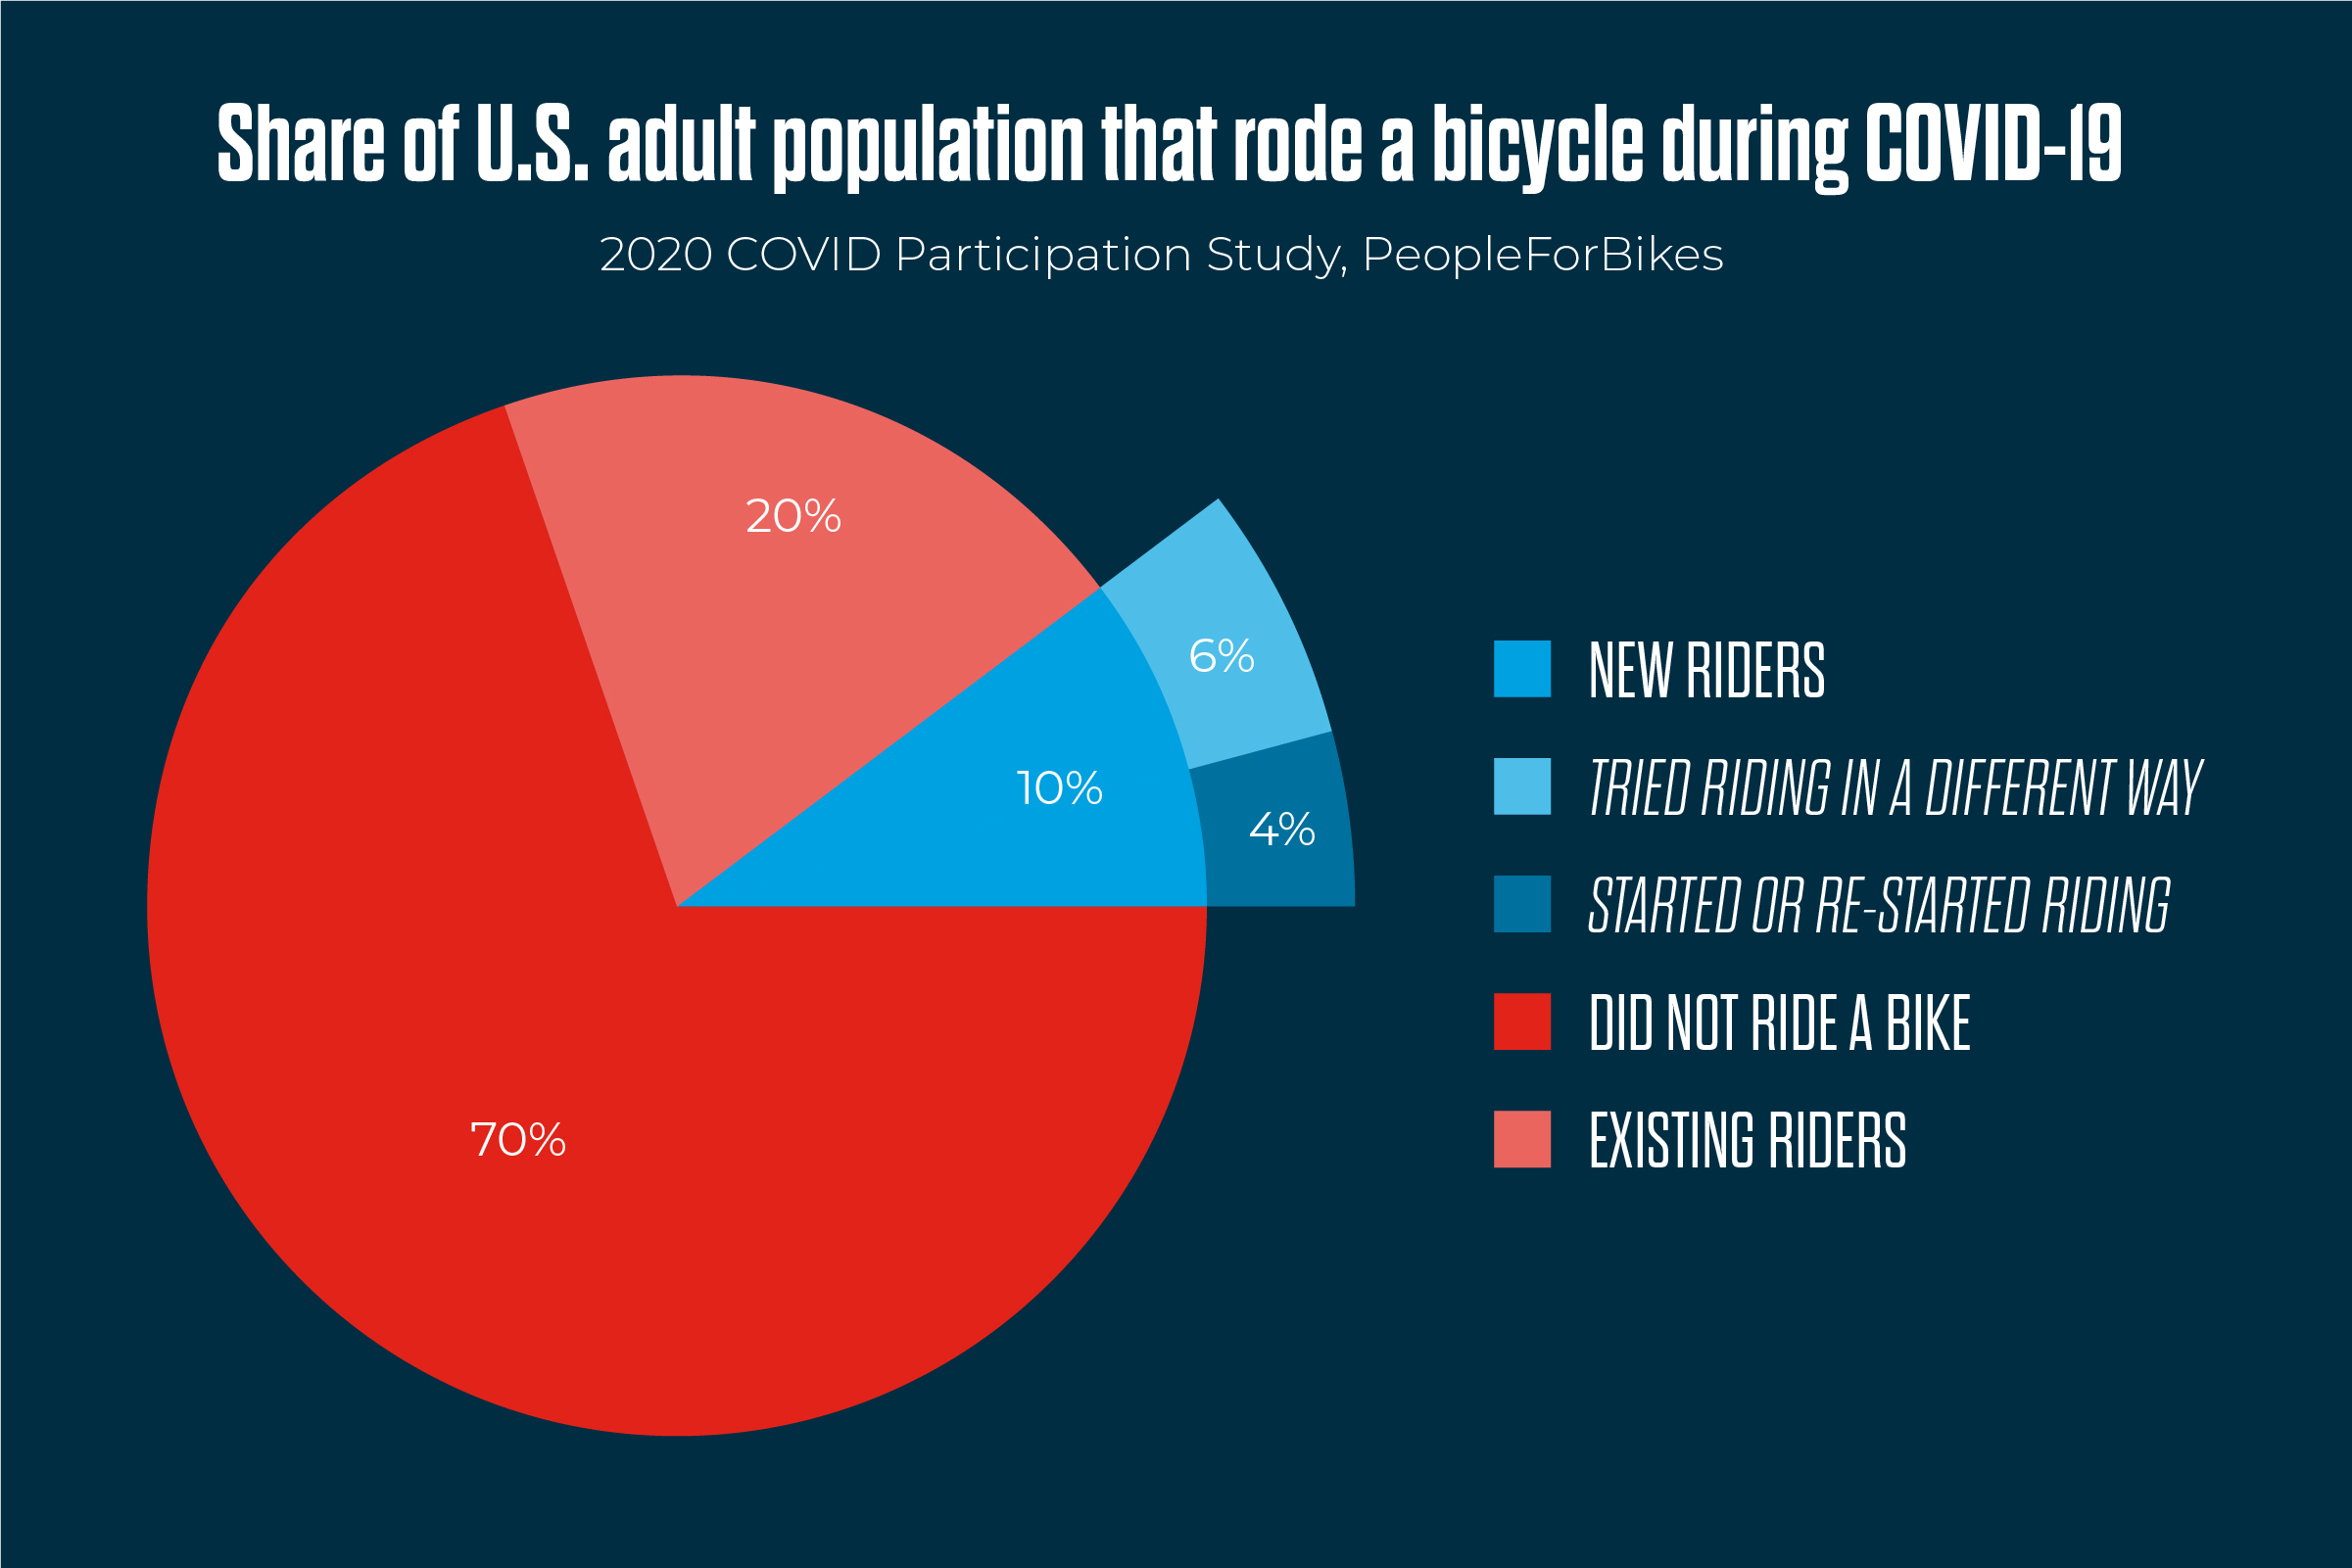
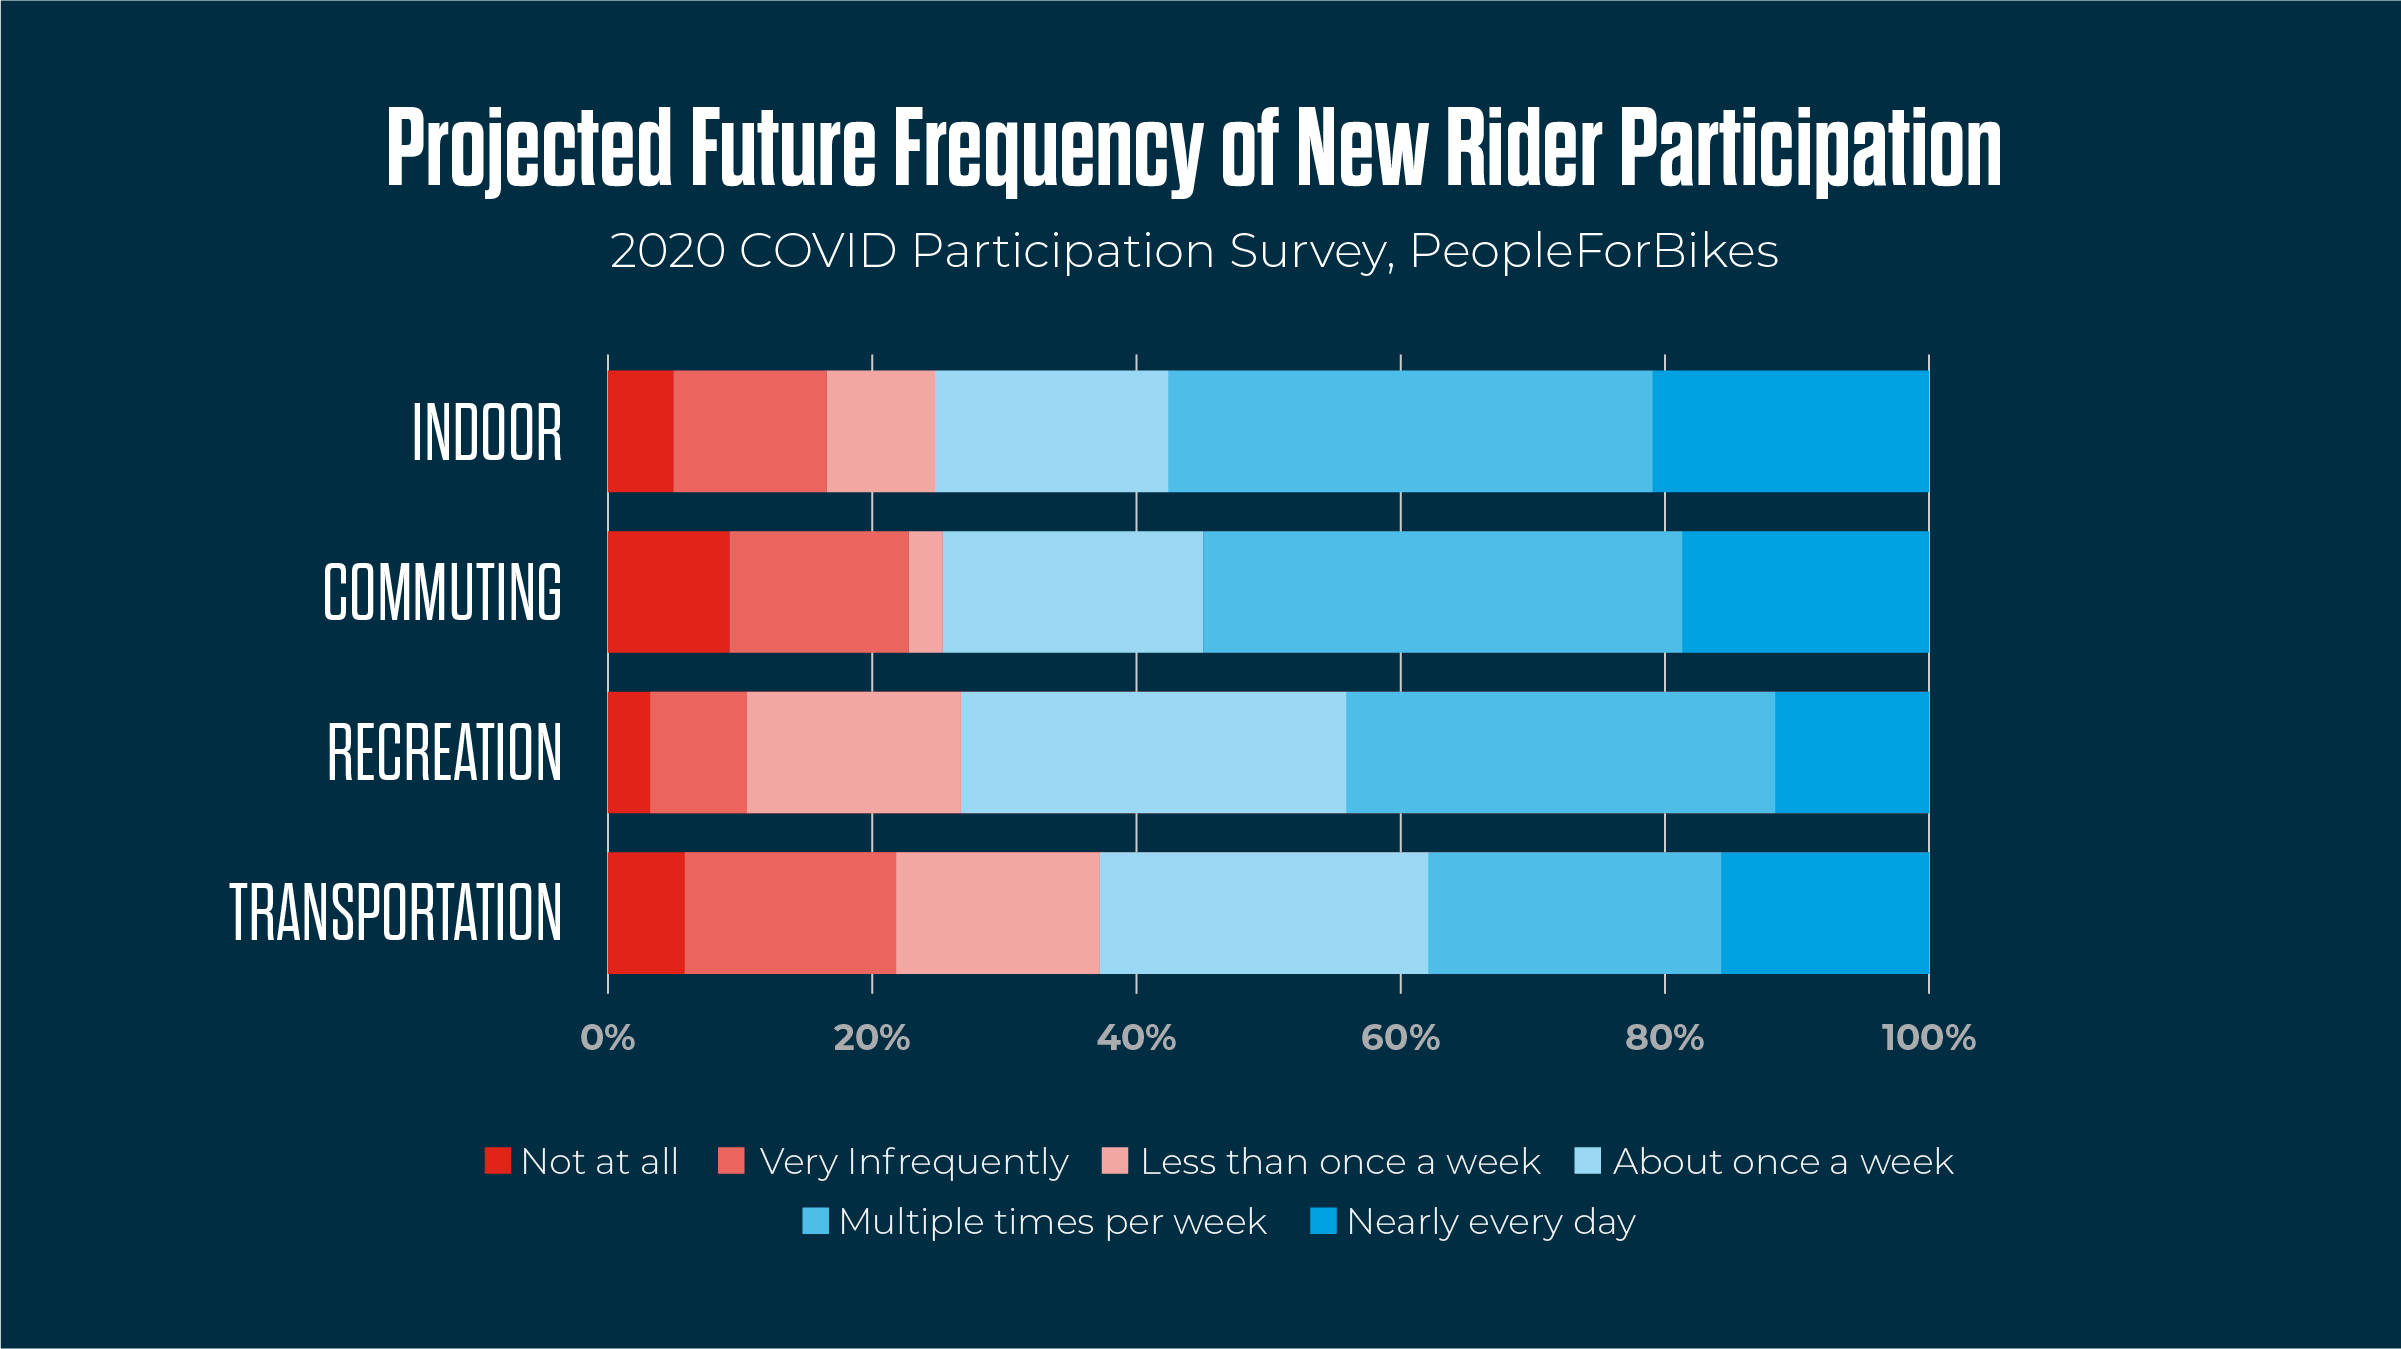
- Most new riders expect to continue to ride post-pandemic, most frequently (multiple times a week or every day) when indoor riding or commuting.
- This article discusses the relatively low annual cost of cycling ($250-$300 for insurance, $100-$300 for maintenance, and equipment costs), which drives a higher frequency of participation among millennials.
- Mountain biking attracts higher-income individuals (half of all participants reside in households with $75,000 and over annual income) and skews male.
Running, Jogging and Trail Running Most Popular Outdoor Sport
- 19.2% of Americans participate in running, jogging, or trail running.
- Running, jogging, or trail running is the most popular young adult (18-24) outdoor sport, with 31% of this age group participating and frequent participants reporting an average of 48.6 running occasions annually.
- Participants were 48% male and 52% female.
- In a global study conducted by ASICS (including the US), 73% of runners claimed they would continue running as much after COVID as during the pandemic.
- As mentioned in early research, this 2017 article by Health.com suggests marathon training and racing spend may average $5,000 (time frame not specified) including costs such as equipment, race fees, travel, and club memberships.
- While casual, recreational running is considered relatively inexpensive, a Verywell Health article highlights running as a potentially expensive hobby depending on the level of participation.
Snow Sports Growing and Expensive
- Nerdwallet estimates annual costs of $1,150 for a casual snow sports participant and $10,000 for an "extreme enthusiast." Costs include gear, travel packages, and insurance.
- Snowsports Industries America noted growth and the highest participation rates during the 2019-2020 snow season among participants 18-24 years (13.1%), 25-34 years (21.3%), and 35-44 years (16.7%). Snowsports in this study include skiing (cross-country and downhill), snowboarding, snowshoeing, and sledding.

- More than 50% of winter sports participants fall in the highest income bracket.
Ultimate Frisbee Works to Reverse Declining Trends

- Participation among core Ultimate Frisbee players grew 6.2% in 2020. However, participation in the sport has declined 47.2% since 2015.
- SFIA reports 858,000 core participants in Ultimate Frisbee, with nearly half (49.2%) between 18-24 and 68.8% male.
- Ultimate Frisbee is generally a low-cost sport, with one participant estimating her overall costs during one summer at $1,700. Costs include $500 for "tryouts, clinics, team fees, uniforms, and registration," and $1,200 for gear, accessories, transportation, and food.
Paddlesports Trending
- According to a 2020 article, paddlesports, including rowing, kayaking, stand-up paddleboarding, and canoeing, are increasing in popularity. The sport was ranked 25th in offering endurance sports benefits (fitness, training opportunities, social network, equipment availability) based on user-driven endurance sports ratings on the Topend Sports website.
- In 2019, females represented 52% of participation in paddlesports and 22.9 million Americans participated in paddlesports.
- Participation in kayaking is increasing, while canoeing participation is declining. In 2018, 2.6 million people participated in whitewater kayaking, a more adventurous kayaking niche.
- Younger adults (18-24) are 9% more likely to paddle for excitement and adventure, while middle-aged adults are 6% more likely to participate to exercise and 5% more likely to participate to be close to nature. Individuals over 55 are 12% more likely to participate in paddlesports for exercise.
- Experienced canoeists spend less time on the water (1 hour per occasion) compared to new canoeists (3-4 hours per occasion).
- Kayakers stay closer to home (within 10 miles on average) and spend 3.9 hours during each occasion, on average.
- Kayaking can be relatively inexpensive, though the cost of the kayak drives much of the initial outlay, with costs ranging from $200 for an inflatable kayak to $1,500 and more depending on the needs. Other costs include paddles, transportation to the kayaking location, flotation devices, licenses, and any accessories. This article highlights kayaking as inclusive, in part due to its ability to fit any budget.
Triathlon Working To Overcome Cost Barrier and Attract New Users
- According to USA Triathlon, there are 400,000 active tri racers, with the average racer in their mid-40s. The sport views the non-endurance, casual athlete as a high-potential, but difficult-to-convert target.
- USA Triathlon noted an effort to attract younger adults and women to the sport.
- In 2019, the New York Times noted a 5-year decline in triathlon participation, reporting a -25% change in membership over this time period.
- Younger individuals drove some of this decline, which may be due in part to increasing equipment costs associated with the sport (road bikes may cost above $1,000 in many cases) acting as a barrier to participation. A USA Triathlon survey found the average annual income of triathlon participants was above $100,000.
- Early research indicated the average annual cost of Triathlon participation could be estimated at $2,900, with an initial year average of $700 and a second-year cost of $5,600 (which includes one-time purchases, such as bikes and wetsuits).
- For the highest tier of triathletes (those participating in Ironman competitions), spending upward of $8,000 for one competition is common.
- Average age group triathletes spend 9-14 hours per week training for the sport.
Golf Participation Increasing
- On-course golf participation increased 2.2% in 2020, while off-course golf activities (e.g., driving ranges) increased 21.7%. Off-course golf participation increased 72.2% from 2015-2020.
- The National Golf Foundation highlights young adults as one of the largest demographic segments, with 5.9 million on-course participants aged 18-34 and 5.0 million off-course participants aged 18-34.
- The potential golf player pool is high (17 million). This segment did not play in 2020, but claims to be "very interested" in playing on a golf course.
- The number of rounds played on a golf course increased 14% in 2020, to 502 million rounds. Golfers averaged 20 rounds in 2020.
- An average round of golf at a public course cost $36 in 2018, according to a Golf Week survey, resulting in total annual course costs of $720 (20 rounds x $36 per round). A round at a top course is significantly more costly and may run anywhere from $500 to $700 per round.
- Annual costs for membership in private golf clubs are substantially higher, ranging from $3,000 to $100,000.
- Lumen Sports notes that beyond golf course fees and membership costs, the cost of equipment, coaching/lessons, and apparel make golf one of the most expensive sports.
Tennis Surging In Popularity
- The US Tennis Association (USTA) noted that tennis participation increased 22% in 2020, 3 million new players picked up a racket (+44%), and 4 million more people played tennis in 2020 than in 2019. Entry-level racquet sales are reported to have grown almost 40% in 2020.
- Tennis grew more than other "traditional" sports in 2020, with 6.78 million new or returning players (compared to 2.82 million players who stopped in 2020).
- Over five years (2015-2020), tennis grew 20.5%
- U.S. Tennis Association CEO and executive director Mike Dowse said of the growth in 2020, "It’s some of the best growth numbers we’ve ever seen. We knew it was coming, but I don’t know if we expected the numbers to be as powerful as they were. It’s definitely a silver lining to what was a challenging year."
- The USTA highlights 300,000 adult players in their competitive leagues.
- The US Tennis Association (USTA) reported 9.67 million "core" tennis players (played 10+ times in one year) in 2018, accounting for 93% of total occasions.
- Total "core" equipment spending was estimated at $701.6 million ($72.55 per player in 2018). One player suggests that indoor tennis court rental could cost upwards of $1,000 per month ($12,000 annually) in colder and higher-cost areas of the country. The most frequent (core) players account for 85% of tennis economy spend.
Research Strategy
This research was focused on providing adult sport-specific metrics associated with sports participation across 14 sports identified in early research as top adult sports (either based on growth statistics or more qualitative rankings). Spending and frequency of participation were prioritized and provided as available, though information associated with participation numbers and growth and demographics were also included when relevant. We leveraged a diverse range of sources, including surveys (e.g, SFIA, Outdoor Sports), association insights (e.g., USTA, National Golf Foundation), credible blogs (e.g., Nerdwallet), news articles (e.g., USA Today), and sports-specific websites (e.g., PeopleForBikes). As mentioned in early research, information available to address this question was fragmented, and therefore we expanded our search to include sources before 2019 when the information was considered relevant, as well as included sources more qualitative in nature. This research references "core" participants several times, who are defined as a more frequent participation segment for that sport.