Part
01
of one
Part
01
Deli Market Research
Key Takeaways
- The global deli food market is anticipated to reach $432.24 billion by 2027, growing from $305.12 billion in 2021 at a compound growth rate (CAGR) of 4.4%. In 2020, the top product segments were pies & savory appetizers (28.77%), prepackaged products (22%), meat (17.52%), and sauces, condiments, & dressings (15.81%). Other segments, including soup and prepared salads, accounted for 15.9% of the global market.
- The Agricultural Marketing Service of the US Department of Agriculture publishes a weekly price report for different types of products, including deli products. Deli products are only provided in two reports: Pork and Turkey. Moreover, the reports break down prices by US regions. The price point range for deli ham in the Northeast is $3.99-$11.99. A pound of Turkey Pastrami from a private brand costs, on average, $5.32 nationally.
- The plant-based deli meat market is estimated to be $365.76 million in 2021.
- The dominant players, ranked by revenue, in the deli market are Kraft Foods, Morrisons Supermarkets, Hormel Foods, Conagra Brands, 2 Sisters Food, Boar's Head Brand, and Brazil Food (BRF).
- The dominant players, ranked by revenue, in the deli meat market are Cargill, JBS, Tyson Foods, Sigma Alimentos, Maple Leaf Foods, Samworth Brothers, and Astral Foods.
Introduction
This research brief analyzes the deli and deli meat markets in the United States and globally. The deli market analysis includes the current market size globally and in the United States, the regions/countries with the largest market share in the global deli market, the global market breakdown by product type, the purchasing drivers for deli meats in the United States, and the price points for US deli products' broken down by product and by US region. The attached spreadsheet details the breakdown of deli products price points by product and by US region. Moreover, the research provides a detailed analysis of the deli meat market, including the current market size globally and in the United States, the regions/countries with the largest market share in the global deli meat market, and the share of deli meat in the global protein market. It also provides an estimate of the global plant-based deli meat market size by assuming that the plant-based deli meat will represent the same share in the deli meat market as the plant-based meat represents in the total meat market. The research carries on to provide an overview of the deli meat market, including some general statistics of the market. However, we were unable to find the breakdown of the deli market sales by foodservice, bulk retail, and traditional retail (packaged).
The research identifies seven dominant players in the deli market and seven dominant players in the deli meat players. These two lists are extracted from market reports and industry experts' reports. We ranked the dominant players by revenue. For each player found, the research provided a brief overview, the website, and a list of their deli meat products. We detailed the identification process in the attached spreadsheet (Identification tab).
The research findings were added to the attached presentation (Google Slide). Further details on the logic, assumptions, and calculations can be found in the Research Strategy section and within the report.
Deli Market Analysis
- According to a market report from Market Data Forecast, the global deli food market is anticipated to reach $432.24 billion by 2027, growing from $305.12 billion in 2021 at a compound growth rate (CAGR) of 4.4%.
- The market is segmented by type into five major categories: meats, prepackaged sandwiches, pies & savory appetizers, soup, and prepared salads.
- Market reports found that the chilled and deli food market will experience steady growth over the next decade. Below we presented some of these reports.
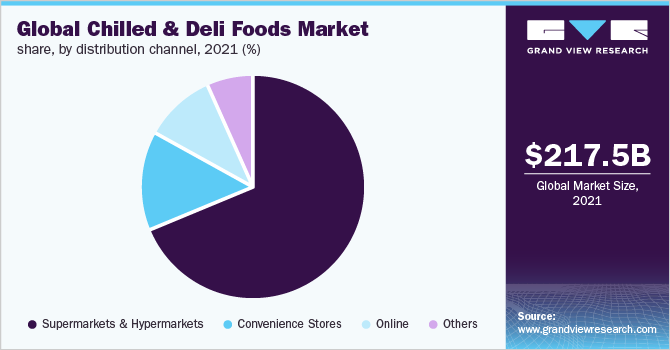
- According to Allied Market Research, the global chilled and deli food market will increase from $888 billion in 2020 to reach $1.64 trillion by 2031, recording a compound growth rate (CAGR) of 4.2% between 2021 and 2031.
- Other reports from Industry ARC found similar results: The market was valued at $632 billion in 2018 to reach $762.5 billion by 2024, recording a CAGR of 3.8% between 2019 and 2028.
- The regions with the largest market share in the deli market are North America, Asia Pacific, and Europe. The United States has the largest market share, accounting for 13.25% of the market in 2017 (calculated below). Moreover, the growing demand for deli food in Europe is led by Spain, the United Kingdom, and Germany.
- North America is the region with the largest market share, accounting for 29.5% of the global market in 2017. The region will retain its dominance in the chilled and deli food market over the next decade (2031). This dominance is due to the growing demand for ready-to-eat meals in the region.
- Calculation: NA market share = (NA market size / 2017 market size) x 100 = ($52.65 billion / $178.47 billion) x 100 = 29.5%.
- The United States is leading the market, recording a market size of $40.44 billion in 2021, which translates to a 13.25% market share.
- Calculation: US market share = (US market size / global market size) x 100 = ($40.44 billion / $305.12 billion) x 100 = 13.25%.
- Asia-Pacific will witness the highest growth rate (5.6%) over the next decade, due to the increase in the adoption of Western culture and innovative deli foods. Another report from Grand View Research found that the region will register a growth rate of 5.8% over the next decade.
- The market growth in Europe is led by the increased demand for deli foods in countries like the United Kingdom, Germany, and Spain. The region is anticipated to register a market share of 27.12%.
- Calculation: We used a Reverse CAGR calculator to find the global 2025 market size, based on the figures represented in this report. The 2025 global market size will be $267.73 billion. Thus, EU market share = (EU market size / 2025 market size) x 100 = ($72.6 billion / $267.73 billion) x 100 = 27.12%.
- Based on the publicly available data, we provided an estimate of the breakdown of the deli food market by product type into pies & savory appetizers, prepackaged products, meat, sauces & condiments, and other types. In 2020, the top product segments were pies & savory appetizers (28.77%), prepackaged products (22%), meat (17.52%), and sauces, condiments, & dressings (15.81%). Other segments, including soup and prepared salads, accounted for 15.9% of the global market. Below, we outlined how this market breakdown was calculated.
- The prepackaged category accounted for 22% of the global market in 2017. We assumed that the category would maintain its market share over the next few years, based on the fact that despite the growth in other categories, the prepackaged products will maintain growth over the next three years.
- The pies & savory appetizers' category accounted for 28.77% of the global market in 2020.
- Calculation: Category market share = (category market size / global market size) x 100 = ($255.674 billion / $888.628 billion) x 100 = 28.77%.
- The sauces, condiments, & dressings segment accounted for 15.81% of the global market in 2017. We assumed that the category would maintain its market share over the next few years, based on the fact that despite the growth in other segments, the sauces & condiments segment will maintain growth over the next three years.
- Calculation: Category market share = (category market size / global market size) x 100 = ($28.23 billion / $178.47 billion) x 100 = 15.81%.
- The meat segment accounted for 17.52% of the global deli food market in 2020.
- Calculation: Category market share = (category market size / global market size) x 100 = ($53.46 billion / $305.12 billion) x 100 = 17.52%.
- Other segments, including soup and prepared salads, accounted for 15.9% of the global market in 2020.
- Calculation: Other segments share = 100% - (sum of calculated shares) = 100 - (22+28.77+15.81+17.52) = 15.9%.
- Note: The market shares were calculated based on the figures in the related report.
- The United States chilled and deli food market in the United States grew from $32.24 billion in 2020 to $40.44 billion in 2021.
- The market will register a CAGR of 22.35% between 2020 and 2026, reaching $108.18 billion by 2026.
- According to an IRI report, the US deli sales in 2021 reached $40.8 billion, growing by 11.1% from 2020. In January 2022 alone, the department sales recorded $4 billion.
- The IRI breaks down the deli market by type into four segments: deli meat, deli cheese, deli entertaining, and deli prepared. In 2020, the top product segments in the US deli market were deli prepared (51.23%), deli meat (18.87%), deli cheese (18.87%), and deli entertaining (11.03%).
- The deli meat segment recorded sales of $7.7 billion in 2021, accounting for 18.87% of the deli department sales. In January 2022 alone, the department sales recorded $764 million.
- The deli cheese segment recorded sales of $7.7 billion in 2021, accounting for 18.87% of the deli department sales. In January 2022 alone, the department sales recorded $748 million.
- The deli entertaining segment recorded sales of $4.5 billion in 2021, accounting for 11.03% of the deli department sales. In January 2022 alone, the department sales recorded $451 million.
- The deli prepared segment recorded sales of $20.9 billion in 2021, accounting for 51.23% of the deli department sales. In January 2022 alone, the department sales recorded $2 billion.
- Calculation: For each segment, the following formula was applied (the meat segment is presented as an example): Segment market share = (segment sales / deli sales) x 100 = ($7.7 billion / $40.8 billion) x 100 = 18.87%.
- An online survey conducted by the National Cattlemen’s Beef Association (NCBA) on 1,193 consumers in the United States found that 35% of respondents have increased their deli-prepared purchases (or just started purchasing), as compared to six months ago. Among current deli-prepared products shoppers, about 42% shop for these products on a weekly basis.
- When asked about the purchasing drivers for deli products, nearly 23% of respondents said convenience. Other respondents mentioned freshness (16%) and ease (13%). The chart below outlines the survey results.
- The main reason for retailers to purchase deli foods is the growing demand for this type of products in the United States. In fact, the deli department sales growth was up 2.8% between 2019 and 2020. Fifty-one percent of American consumers purchased more prepared and deli foods in 2020.
- The Agricultural Marketing Service of the US Department of Agriculture publishes a weekly price report for different types of products, including deli products. Deli products are only provided in two reports: Pork and Turkey. Moreover, the reports break down prices by US regions.
- The attached spreadsheet details the breakdown of deli products' price points by product and by region.
- The price point range for deli ham in the Northeast is $3.99-$11.99. A pound of Turkey Pastrami from a private brand costs, on average, $5.32 nationally.
Global Market Size and Growth
Global Market: Regional Breakdown
Global Market: Breakdown by Product Type
US Market: Size and Growth

US Market: Breakdown by Product Type
US Market: Purchasing Drivers

US Price Points
Deli Meat Market Analysis
- According to a market report from Million Insights, the global deli meat market is anticipated to reach $90.94 billion by 2028, growing from $53.46 billion in 2020 at a CAGR of 6.9% between 2020 and 2028.
- The market is segmented by product into two segments: Cured and uncured. In 2020, the cured segment accounted for more than 60% of the global market.
- While other reports found different values, every market report we encountered found that the deli meat market will experience steady growth over the next decade. According to ReportLinker, the global deli meat market will increase by $86.89 billion between 2020 and 2025, recording a CAGR of 8%.
- The regions with the largest market share in the deli market are North America and the Asia Pacific.
- North America is the region with the largest market share, accounting for 30% of the global market in 2020. The region will retain its dominance in the deli meat market over the next few years. This dominance is due to the growing awareness and demand for deli meat in the United States and Canada.
- Asia-Pacific will witness the highest growth rate (8.9%) over the next decade, due to the increasing demand for deli meat products in China and Australia.
- In 2021, the global meat market was valued at $1.33 trillion, while the global deli meat market was $53.46 billion in 2020. We calculated the deli meat market size for 2021 by putting these entries in this reverse CAGR calculator:
- Starting value is 53,460,000,000 (2020)
- CAGR is 6.9%
- The number of periods is 1 (year), calculated by subtracting 2021 from 2020.
- Based on these figures, the calculator states that the 2021 market size would be around $57,150,000,000 or $57.15 billion.
- Thus, the market share of deli meat in the global meat market was 4.29%.
- Calculation: segment market share = (segment market size / global market size) x 100 = ($57.15 billion / $1.33 trillion) x 100 = 4.29%.
- According to an IRI report, the US deli meat market recorded sales of $7.7 billion in 2021, growing by 5.3% from 2020.
- In January 2022 alone, the market sales recorded $764 million.
- The IRI breaks downs the market by type into three segments: Grab & go, pre-sliced, and service deli meat. Sales in the grab & go and pre-sliced segments increased by 55.5% and 20.3%, respectively, between 2020 and January 2022.
- The service deli meat experienced a decline of 1.3% during the same period.
Global Market Size and Growth
Global Market: Breakdown by Region
Share in the Global Meat/Protein Market
US Market Size and Growth
Plant-based Deli Meat Market Size
- According to Good Food Institute (GFI), in the plant-based market, "product formats like deli slices and bacon are still relatively small subcategories, highlighting potential for development and growth in these areas."
- Assumption: We assumed that the plant-based deli meat market would represent the same share in the deli meat market as the plant-based meat represents in the total meat market.
- In 2021, the global meat market was valued at $1.33 trillion. The plant-based meat reached $8.5 billion in 2020. Thus, the market share of plant-based meat in the global meat market was 0.64%.
- Calculation: segment market share = (segment market size / global market size) x 100 = ($8.5 billion / $1.33 trillion) x 100 = 0.64%.
- Hence, we assumed that the plant-based deli meat accounted for 0.64% of the global deli meat market in 2021. As explained above, the 2021 deli meat market was $57.15 billion (Share in the Global Meat/Protein Market section). Thus, the plant-based deli meat market is estimated to be $365.76 million in 2021.
- Calculation: segment market size = (global market size x market share) / 100 = ($57.12 billion x 0.64) / 100 = $365.76 million.
Deli Meat Market Statistics
- Thirty-one percent of shoppers prefer seeing "deli flavors and menu options rotate on a monthly basis.
- An online survey conducted by the National Cattlemen’s Beef Association (NCBA) on 1,193 consumers in the United States found that 45% of respondents would like to have more beef options when shopping in the deli-prepared section.
- The survey also found that 28% of deli prepared consumers mention prices as the main barrier for purchasing such products. Next comes the lack of desired options (20%) and the desire to cook for themselves (19%).
- According to IRI data, the preferred deli meat type is the pre-sliced deli meats, accounting for 9.8% of the deli meat category dollar sales. "Similarly, grab-and-go deli meats tallied 25.1% of dollars, up 61.1%, while service deli meat rounded out the category at 65% of sales, down 1.8%."
- Eighty-two percent of deli products shoppers "want to make their choices in the department quickly, with half saying they know exactly what they want in advance. In fact, 76% of grocery shoppers want grab-and-go options.
- In 2020, more than half of deli products shoppers bought from the deli department at least once a week.
- As of 2019, about 26% of consumers pick fresh food shops based on the availability of prepared foods, while 66% of consumers buy prepared foods at least three times monthly.
Deli Market — Dominant Players
- The dominant players, ranked by revenue, in the deli market are Kraft Foods, Morrisons Supermarkets, Hormel Foods, Conagra Brands, 2 Sisters Food, Boar's Head Brand, and Brazil Food (BRF). The process of identification and ranking of these players has been outlined in the attached spreadsheet. Below, we provided, for each player, a brief overview, their website, and a list of their deli products.
- Kraft Foods is one of the largest global food and beverage firms, with operations in more than 40 countries. Kraft has about 24 sub-brands, including Heinz, Philadelphia, and Golden Circle. The company operates one deli food brand: Oscar Mayer. The brand produces cold cuts, sausages, turkey, and more. An example of their deli products is the Oscar Mayer Deli Fresh.
- Morrisons Supermarkets is the fourth largest supermarket chain in the United Kingdom. The supermarket chain sources and processes half of the fresh food they sell in their stores and manufacturing facilities. Under the Deli Counter segment, the company manufactures and sells deli cheese quiche, deli Wiltshire ham, deli cooked ham, deli chicken slices, deli caramelized onions, among others.
- Hormel Foods is a global food company, with operations in more than 75 countries worldwide. The company has more than 40 sub-brands, including Hormel® Natural Choice®, Justin’s®, and Wholly®. They offer a wide range of deli meats and products through their Hormel® Deli Meats brand, which includes ham, beef, Italian meats, turkey, and chicken. In 2021, Hormel introduced deli prepared meals.
- Conagra Brands is a global food company, with operations in 50 locations. The company has more than 60 sub-brands, including Duncan Hines®, Marie Callender's®, and Slim Jim®.
- 2 Sisters Food is a poultry, chilled, and bakery food company, based in the United Kingdom. The company serves the retail and foodservice sectors. The company offers prepared meals solutions.
- Boar's Head Brand produces deli meats and cheeses. The company's portfolio includes beef, ham, turkey, chicken, bacon, franks, bolognas, sausages, and loaves. The deli cheese products include "sharp cheddar cheese, sharp American cheese, yellow and white American cheese, Provolone cheese, Muenster cheese and condiments."
- Brazil Food (BRF) is a global food company, operating in 117 countries. The company has about 33 sub-brands. The sub-brands that offer deli products are Sadia and Kidelli.
Deli Meat Market — Dominant Players
- The dominant players, ranked by revenue, in the deli meat market are Cargill, JBS, Tyson Foods, Sigma Alimentos, Maple Leaf Foods, Samworth Brothers, and Astral Foods. The process of identification and ranking of these players has been outlined in the attached spreadsheet. Below, we provided, for each player, a brief overview, their website, and a list of their deli meat products.
- Cargill is a global "food, agriculture, nutrition and risk management" company. In their deli segment, the company offers bulk deli meats, sliced deli meats, and fully cooked prepared meats. Their deli brands are Castle Wood® Reserve and Charter Reserve®.
- JBS is a global protein company, which produces beef, poultry, pork, and lamb products. Their US Pilgrim sub-brand "includes a case ready divisions with eight production facilities that specialize in producing traditional tray pack, deli and boneless dark meat poultry products for retail."
- Tyson Foods is a multinational protein food company. The company has about 35 sub-brands. Some of their sub-brands include Tyson®, Hillshire Farm®, BallPark®, and State Fair®. The company offers a wide range of deli products and ingredients through their Sara Lee, Russer, Wilson, Weaver, and Wunderbar brands.
- Sigma Alimentos is a global food company, with operations in 18 countries. Their brand portfolio consists of more than 50 sub-brands. The company's products include ham, sausages, bacon, and pre-cooked meals.
- Maple Leaf Foods is a Canadian sustainable protein company. They have 23 sub-brands. The company offers deli products through their Deli Express brand. The brand specializes in deli sandwiches.
- Samworth Brothers is a family-owned business in the United Kingdom that produces chilled and ambient foods. The company owns six brands, including Ginsters, Urban Eat, Soreen, and Walker & Son. Their deli brand is Walkers Deli and Sausage Co., which produces "premium sliced cooked meats and sausages."
- Astral Foods is South Africa's largest poultry producer. The company owns 13 brands in and outside South Africa. Their "key activities are animal feed premixes, broiler genetics, sale of day-old chicks and production and distribution of a variety of fresh, frozen and value added chicken products."
Research Strategy
For this research on the deli and deli meat markets, we relied on the most reputable sources of information that were available in the public domain, including industry-related websites, market reports, statistic portals/databases, and trusted media articles. Therefore, we checked industry-related websites, such as Food Institute, Good Food Institute, and Deli Market News. We also checked government databases, such as the Agricultural Marketing Service of the US Department of Agriculture. Moreover, we scoured research websites like Research Gate and Business Wire. We also checked consulting websites such as Statista and Deloitte, and media websites like Reuters and Forbes. However, we were unable to find the breakdown of the deli market sales by foodservice, bulk retail, and traditional retail (packaged).
To calculate the requested market sizes and shares (breakdown), we outlined our assumptions and calculations in each section. To find the global plant-based deli meat market, we assumed that the plant-based deli meat market would represent the same share in the deli meat market as the plant-based meat represents in the total meat market.
To determine the dominant players in the deli and deli meat market, we relied on six unranked lists of the dominant players in the two markets. We did so because we noticed that some of the dominant players in the deli meat market are also dominant players in the general deli food market. These lists are extracted from market reports and industry experts' reports. Below are the six lists we analyzed:
- Deli Food Market
- Deli Food Market by Market Data Forecast
- Global Deli Foods Sales Market
- Deli Meat Market Size
- Deli Meat Market Report
- Global Deli Meat Market
We combined these lists to get a final list of 26 companies. Next, We focused our research on the companies that are present in at least two of the lists. This step narrowed down our research to 14 companies. Moreover, we analyzed and examined the products of all the assembled companies to create two lists: the deli food list and the deli meat list. Next, we looked for the annual revenue of these companies to rank them by revenue. We detailed our process in the attached spreadsheet (Identification tab). At the end, we gathered a list of seven dominant players in the deli market, ranked by revenue (Deli Market - Dominant Players tab) and another list of seven dominant players in the deli meat market, ranked by revenue (Deli Meat Market - Dominant Players tab). For each company, we provided a brief overview, their website, and a list of their deli or deli meat products.
Note #1: Some of these companies are private and are under no obligation to share their annual revenue. In this case, we relied on third-party sources, such as ZoomInfo.
Note #2: Some companies publish their annual revenue in their local currency. In this case, we used the average exchange rate for the year the revenue is published in. This helped us to compare the annual revenues in the same currency (US$).