Part
01
of one
Part
01
Corporate Events and Food Delivery Industry
We have compiled data on four areas for the corporate events and food delivery industries. These are general data on the industry, data on the recovery from the 2003 SARS epidemic, data on recovery from the Great Recession, and forecasts for recovery from the COVID pandemic. For both industries, SARS was found to have a minimal global impact and that meant data on the recovery was scarce. COVID impacted the two industries very differently, with the corporate events' industry seeing a sharp decline in revenue while the food delivery industry saw growth. Because of this, general forecasts on the future of food delivery are provided but they are not specifically related to a recovery.
Corporate Events Industry
General Data
- When research found limited publicly available data on the corporate events' industry, different terminology was used in order to drill down to the specific industry of interest. This research led us to the acronym MICE, which stands for Meetings, Incentives, Conferences, and Exhibitions. The definitions provided by theplanner.guru for these different types of events indicates that this is primarily focused on business events, and was therefore a good alternative to "corporate events." It was also mentioned that there has been a push in the industry to use the term "meetings industry" rather than "MICE market," so that was also encompassed into our research.
- In 2018, the global MICE market was estimated to be $860 billion, with a compound annual growth rate (CAGR) of between 7 and 8% through 2023. This report was published in 2019 and therefore all projections were based on pre-COVID conditions.
- The estimates and projections above were very similar to those in another report which estimated the MICE market size to be $805 billion in 2007, with CAGR of 7.6% from 2018 through 2025.
SARS 2003 Recovery
- During the 2003 SARS epidemic, the Centers for Disease Control and Prevention (CDC) did not recommend canceling meetings and events that included "travelers from areas affected by SARS."
- Beginning in 1993, the Covention Industry Council, renamed the Events Industry Council in 2017, began publishing the Economic Impact Study for the meetings and events industry in the U.S.
- According to the 2004 report, the MICE industry in the U.S. "generated $122.31 billion in total direct spending in 2004." Although we could not find the 2003 report online, an article from Hospitality Trends stated that the direct spending for the industry in 2003 was $119.09 billion, which seems to indicate there was very little impact on the industry due to SARS, at least in the U.S. The increase in direct spending from 2003 to 2004 was 2.7% [(122.31-119.09)/119.09*100].
- An article published in 2008 shared data on the historical annual exhibition demand growth in the U.S. and Canada from 1972 through 2007. In 2001, after about a decade of growth, demand for net square feet (NSF) of exhibition space decreased by 1.5%, the number of exhibiting companies decreased by 2.7%, and the number of attendees decreased by 5.8%. This trend continued in 2002 with decreases in all three areas. However, in 2003, while NSF decreased by 0.4%, both exhibiting companies and attendees increased, which could indicate that SARS did not have a significant impact on the industry.
- According to data from the World Health Organization (WHO), there were 8,422 cases of SARS worldwide, with 916 deaths. The countries most impacted were China (5,327 cases), Hong Kong (1,755), Taiwan (665), Canada (251), and Singapore (238). The relatively low number of cases worldwide may explain why there appeared to be little impact on the events' industry. However, although this number is not specific to the events' industry, Hong Kong did have many hotels with a 10% or below occupancy rate in March and April 2003, compared to the more typical 86% usually seen at that time.
2008 Recession Recovery
- In 2009, the Conventions Industry Council moved from producing the Economic Impact Study to periodically producing the Economic Significance Study. This new format contained primary survey research for the first time.
- Data for 2009 indicated that direct spending in the industry that year in the U.S. was $263.44 billion. Of this amount, $150.67 billion was related to meetings and other commodities, while the remaining $112.78 billion was for travel and tourism related to the events.
- In early 2017, Convene Magazine published their Annual Meetings Market Survey. This was the 26th such report, and in it they looked at data from 2007, just prior to the U.S. recession, to 2016. This provided some data points to determine how the meetings' industry was impacted by the recession. Of note, this survey is U.S. based and 59% of respondents work for associations, while only 20% work for corporations.
- In 2007, the yearly average convention/meeting budget of respondents was $1.1 million, which increased to $1.7 million in 2008, and then decreased in both 2009 and 2010 to $1.3 million and $1.2 million, respectively.
- Average attendance was also compared in the survey, and it went from 4,400 in 2007 to 3,744 in 2008; 4,409 in 2009; and 4,409 in 2010. This does show a dip in attendance in 2008 but there is no analysis of the reason.
- There was no significant difference in the number of exhibitors from 2007 to 2010 for events that had an exhibition.
- A report from Phocuswright published in 2011 reported that, in the U.S., spending in the corporate groups and meetings industry declined almost 30% in 2009. The majority of this report is behind a paywall. However, an extensive highlight report can be accessed with registration.
- Finally, although we were not able to access the report in its entirety (the link was broken), the International Association of Conference Centres (IACC) reported in the 2015 edition of "Trends in the Conference Center Industry," that the corporate meeting industry had finally recovered from the Great Recession. Based on this reporting, it appears to have taken several years for the industry to fully recover.
- The Incentive Research Foundation reported that pre-recession revenues in the U.S. were not reached until 2011.
Post-COVID Forecasts
- Prior to the pandemic, Allied Market Research estimated that the U.S. corporate event market would grow by a CAGR of 18.5% from 2019 through 2026. Allied conducted an analysis of the impact of COVID on the industry, but it was, unfortunately, behind a paywall.
- A report from SpendEdge, published in September 2020 and including impacts from COVID, estimated that the CAGR over the next five years in the global meetings and events industry would be 6.34%.
- In 2019, the U.S. B2B trade show market was valued at $15.58 billion dollars, and is projected to drop to $5.56 billion in 2020. Projections through 2024 show that the industry will not recover to 2019 numbers by then. Although this only represents the trade show market, and not the corporate meetings market in its entirety, it is instructive to see the impact on this segment.
- According to a report by McKinsey, business travel related to "industry conferences, trade shows, exhibitions, and events" will be the slowest to recover after the pandemic. The availability of a vaccine will likely bolster confidence in attending these types of events.
- A report from the Incentive Research Foundation indicates that they don't expect the MICE industry to fully recover for a minimum of 18-24 months. Based on the importance of a widely available vaccine to the industry getting back to normal, some experts predict pre-COVID revenues will be reached in late 2022 or early 2023. The impact of COVID on the travel industry, part of which is due to corporate events, has exceeded the impact from 9/11 and the Great Recession.
- Many events that were postponed due to COVID were originally rescheduled for the 3rd or 4th quarter of 2020, but now have been pushed to 2021 and 2022.
- A survey conducted in June 2020 of meeting and event planners, not necessarily those only in the corporate meeting space, found that 35% of them, the largest percentage, said they would be ready to attend events with 100 or more people in the 1st or 2nd quarter of 2021.
Food Delivery Industry
General Data
- Statista reported that the online food delivery market size was $76.2 billion in 2017, estimated to be $136.4 billion in 2020, and projected to reach $182.3 billion in 2024.
- The results of a survey from 2011 found that only about 25% of U.S. restaurants had some form of online ordering.
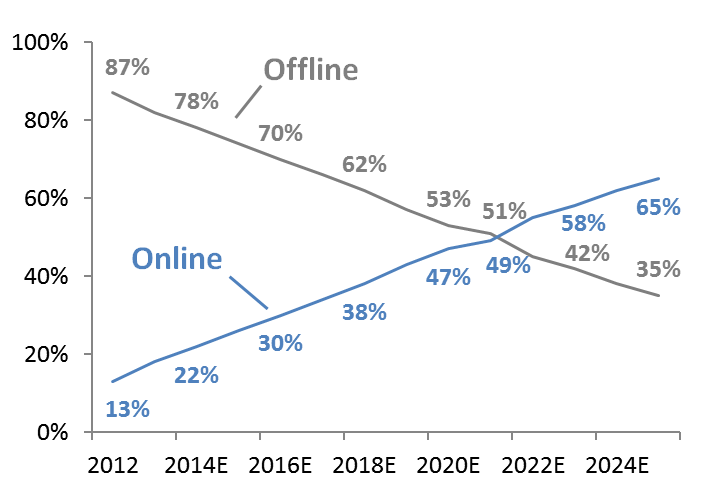
- In 2012, online orders only accounted for approximately 13% of the $70 billion takeout and delivery market. Projections made in a 2015 article indicated that by 2022, online orders would exceed offline ordering. However, the 2012 data also reported that online food ordering was worth about $9 billion in 2012, but there was no breakdown by pick up and delivery.
- A report published by Daedal Research in July 2014 had data on the global takeaway food delivery market, but all the relevant information was behind a paywall.
SARS 2003 Recovery
- There was very little public data on the food delivery industry prior to 2012. However, we did find reporting from May 2003 that stated the takeaway industry was valued at £2.5 billion. To convert this to dollars, we used historical data on the exchange rate and found that the average exchange rate for 2002 was £1=$1.5. Therefore, in 2002, the value of the takeaway industry was $3.75 billion (£2.5 billion * 1.5). Although not fully described, it is believed this figure includes both pick up and delivery.
- Reporting in the New York Times in June 2006 found that curbside takeout, "where customers can have meals delivered to their cars as they sit idling outside the restaurant," grew about 10% annually in the U.S. in the previous three years. Although this is not the same as food delivery, it represents a time when takeout expanded from 100% delivery models like Dominos, to casual restaurants offering their food to go.
- In the U.S., Outback increased "its takeout sales from $104 million in 2000 to $274 million in 2005, or 11 percent of the chain's total U.S. revenue." As with other reporting, the portion of this attributable to delivery only was not publicly available.
- A study published in April 2008 looked at the economic impact of SARS on various sectors of the economy, one of which was restaurants. It showed that Hong Kong did have a dip in restaurant revenue in the first and 2nd quarters of 2003, but that sales had recovered almost to pre-SARS levels by the first quarter of 2004.

- In Canada, revenue in the accommodation and food industry was already declining prior to SARS. However, that decline was sharp in March and April 2003. It wasn't until about 1 year later when the industry fully recovered.

- The overall conclusion of the study was that although there was an impact on the economy, and specifically the restaurant industry, due to SARS, it was mainly in China and Hong. "It should also be noted that in many cases the losses were succeeded by (often equivalent) gains in the following month, quarter or year, such that over a year the effect was marginal at best. The impact from SARS, where it occurred, was therefore usually very short-term."
- It can be concluded from the data found that there was very little recovery needed in the food delivery industry because the impact from SARS was relatively minor.
2008 Recession Recovery
- In the UK, Dominos reported that their takeaway business had grown by 75% in 2008, while Just-Eat, a website where consumers can find and order food from a variety of restaurants, had growth of 250%. It is not clear how much of these orders were delivered.
- A white paper published by Cognizant in 2009 reported that online ordering had taken off in the casual dining space, while quick service restaurants had not yet embraced it. The paper did not delineate between online orders that were picked up and those delivered.
- Since data specific to restaurant delivery was not found publicly available, we pivoted to look at the restaurant industry as a whole, hoping that some insights found would be relatable to the delivery segment. Reporting by Duff & Phelps from 2011 provided revenue numbers for the U.S. restaurant industry from 2006 to 2010, with projections for 2011. Of note, while revenue increased every year, real inflation-adjusted growth declined in 2008, 2009, and 2010.
- According to the graph on page four of the report, it took until about the third quarter of 2010 before same store sales for all restaurant segments showed positive growth.
- Reporting in the New York Times found that sales in the restaurant industry, in inflation-adjusted terms, had never experienced even two years of real sales decline. Due to the recession, there were three.
- Tracking the Restaurant Performance Index from 2004 through today provides a clear picture of how the industry has fared in that time in the U.S.

- It can also be seen in the above graph that the impact to the restaurant industry due to COVID was more severe than the 2008 recession. The drop off in performance occurred much more rapidly and sales declined more steeply.
Post-COVID Forecasts
- A report from Morgan Stanley highlights five trends they expect to see long term as the restaurant industry recovers from the pandemic, and one of them is continued increasing market share of digital and delivery. They propose that "delivery share may have moved forward 2 to 3 years due to COVID-19."
- Takeout accounted for about 90% of quick-service restaurant sales in 2020, up from 63%.
- A survey conducted in April 2020 found that COVID "has had a net positive impact on frequency and spending on online food delivery and the majority of new users (57%) are likely to use it again."
- Similarly, meal delivery orders increased by 67% in March, while restaurant traffic overall declined by 22%.
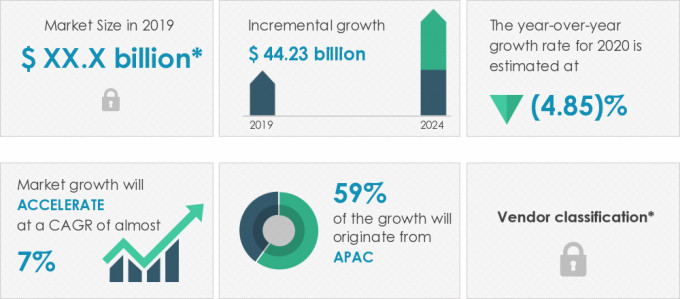
- Technavio produced a market report for the online on-demand food delivery services industry that included the impact of COVID. They project that growth in the industry will average almost 7% per year through 2024, although in 2020 there will be a decline of almost 5%.
- This report from Goldstein Market Intelligence has an in-depth section on how COVID will impact the online food delivery market, but it is behind a paywall.
- Reporting by Statista found that in the U.S., consumers were more likely to place orders directly through restaurants' websites rather than through third-party delivery services.
- It was reported in September 2020, that in India the food delivery industry had recovered to 85% of pre-COVID levels. By October, they were at 100%.