Part
01
of one
Part
01
Clinical Laboratory Services Market
The U.S. market size of the clinical laboratory services market was estimated to be $105.5 billion in 2020. Currently, hospital labs hold the largest share of the market, but stand-alone labs are expected to grow at the fastest rate in the next few years and could overtake hospitals. Some primary growth drivers of the market are an increasing geriatric population, increasing chronic disease, and more use of automation/robots. Three challenges that could impede growth are a lack of skilled workers, continued downward pressure on reimbursement rates, and supply shortages.
United States/North American Market Size
- According to Global Market Insights, the clinical laboratory services industry had a global market size of $249.3 billion in 2019. The North American (NA) share of this was 38.9%, which results in a market size of $97.0 billion (249.3 x 0.389) for NA.
- Grand View Research reported that the global market size of the clinical laboratory services market was $200.3 billion in 2020, and that the North American share was 40.7%. This would result in an estimated NA market size of $81.5 billion (200.3 x 0.407).
- Transparency Market Research reported that the global market size of the industry was $232.6 billion in 2018, with North America accounting for $93.3 billion of that.
- Frost and Sullivan published a report in March 2019 that reported on the market size of the US clinical laboratory services market for 2017. As it was only one of two reports found that publicly disclosed data specific to the US, it is being included even though it may be a bit outdated. For 2017, the US market size was estimated at $78.33 billion. The North American market (Canada and the US) for the same year was $88.66 billion (10.33+78.33).
- StrategyR reports the US clinical laboratory services market is estimated at $105.5 billion in 2020, which was about 47% of the total market size.
Market Size Breakdown
- According to Grand View Research, hospital based laboratories accounted for 55.0% of global revenue in 2020. However, Transparency Market Research indicated that stand-alone laboratories dominated the global market. Grand View's data seemed to be supported by both Industry ARC, and the following chart from Market Research Futures.
- While the above data is based on the global industry, it is likely that the US/North American breakouts would be similar, as those regions account for somewhere between about 39% and 47% of the overall total. While many market research reports were found that provide this data for North America and/or the US, it was all behind paywalls.
- Research was also conducted on U.S. government sites to uncover any public data on laboratory testing in the U.S. While slightly outdated (published in May 2018), a report published on the Centers for Medicare & Medicaid Services (CMS) attempted to determine where laboratory services are most often performed based on Medicare payment data. This showed that 44.2% of Medicare payments for lab services were for "point-of-care tests in hospital outpatient or physician offices," while 38.1% were performed by independent laboratories. This would seem to support the data above indicating that hospital labs account for the largest share of the market.
- It was noted in several reports that independent laboratories are expected to grow at the fastest rate, at least partially due to the increased acceptance of digital pathology.
- Listed below are several paid reports available for purchase that are likely to have the specific breakdown needed.
Market Growth
- Utilizing the same reports referenced above for global market size, several estimates were found for the global CAGR of the industry: 3.9% through 2026, 4.7% through 2028, and 6.3% through 2027. None of these reports publicly disclosed the CAGR specific to either the US or NA.
- Reporting based on 2017 data reported both the global and U.S. CAGR for the period from 2011 to 2017. For the global market it was 6-7%, and for the U.S. it was 6.44%. If the growth trends remained the same going forward, then the growth rate for the U.S. would be expected to be similar to the overall growth rate.
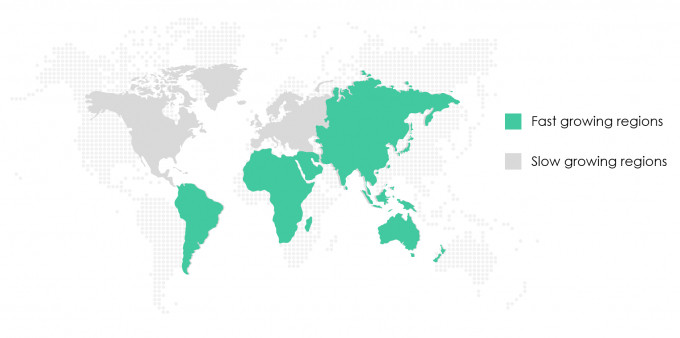
- Asia Pacific is expected to be the fastest growing region, while the U.S. is considered a mature market that will grow at a slightly slower pace.
- The following chart shows the regions that are expected to be fast growing and slow growing from 2021 through 2025. The U.S. is shown as a slow growing region. This seems to indicate that the growth in the US for the next 3-5 years will be lower than the global growth numbers provided above.
- Yarabook published a research report on the North American clinical laboratory test market, and provided a CAGR of 6.3% for the US through 2023. As this market appears to be very similar to the services market, the CAGR was included in the hope it would provide additional value.
- Listed below are several paid reports available for purchase that are likely to have the estimated future CAGR for both the US and North America.
Primary Growth Drivers
Prevalence of Chronic Disease and Cancer
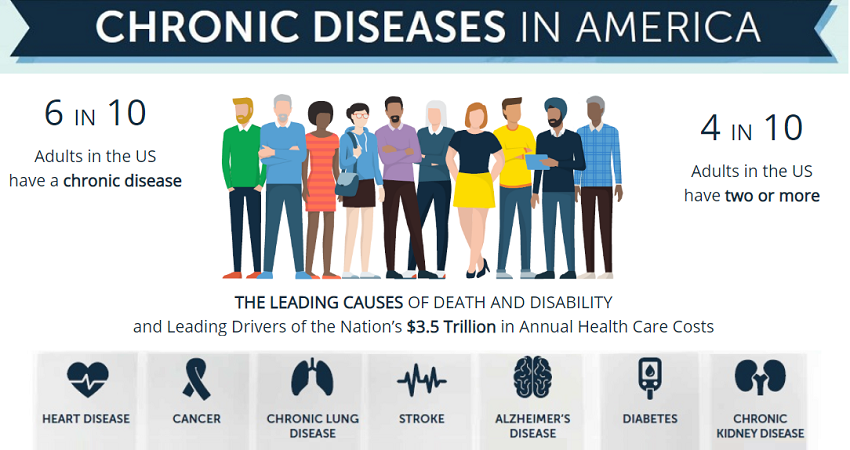
- In the US, between 45% and 60% (depending on the source) of the population suffers from at least one chronic disease, while about 40% suffer from two or more. Since many of these diseases need "support from clinical laboratory services for efficient treatment and patient care," this is one of the primary growth drivers in the industry.
- The chart below shows the growth in various chronic diseases from 2007 through 2017. It is predicted that the growth of these diseases "is likely to continue at the same trajectory."
- Of note, the growth in these diseases is expected to be a result of a growing population, rather than an increased prevalence of the diseases themselves.
- In North America there is a "high prevalence of different types of cancer." For example, it is estimated that in 2018, "around 174,250 people in the U.S. were diagnosed with leukemia." This is expected to increase the amount of tumor testing needed.
- Adults aged 65 and over represented about 15% of the population in 2016, but will represent about 23% by 2060. In numbers, this is an increase from about 49 million to 95 million
Robots
- According to a report by Technavio, the introduction and increased use of robots in labs will be a major driver of growth in the industry.
- ABB Robotics predicts that by 2025, there will be a fourfold increase in the number of nonsurgical robots in the healthcare industry. Of those, 5,000 will be used in laboratories.
- There are already some clinical labs where humans play a supporting role with robots doing the majority of the work. One example of this is Strateos, which is "an on-demand, remote-access laboratory for life science research and drug discovery."
- In 2017, Kalorama predicted that the market size for robotic laboratory automation systems was $8.8 billion. It is likely this has increased since then.
- Some benefits of using robots as the volume of lab services continues to increase are higher processing speed, greater accuracy, safer work environment, and consistent availability of labor.
- Additionally, many of the jobs done in labs are repetitive and can cause musculoskeletal disorders (MSDs). These disorders cause a high-percentage of work-related injury cases, and having robots do the work could ultimately end up reducing some of those costs.
- Globally, the laboratory robotics market is expected to grow at a CAGR of 6.72% through 2026.
Impediments to Growth
Lack of Skilled Workers
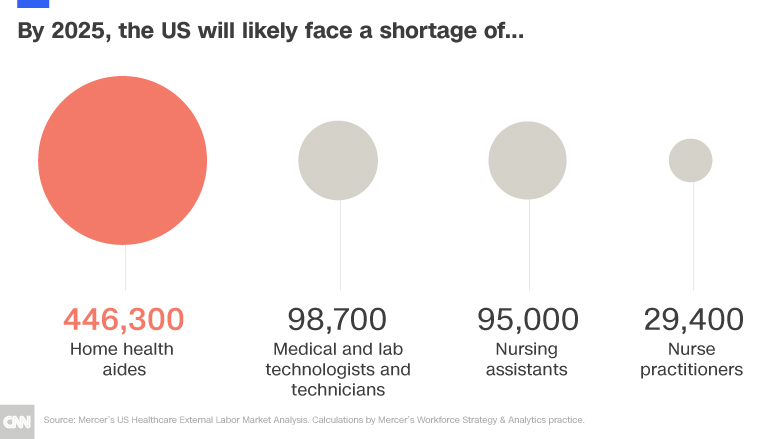
- By 2025 it is expected there will be a shortage of at least 98,700 medical technologists and technicians in the US. This is especially problematic in rural areas. One of the main reasons for the growing shortage is that there are more people in the field retiring than there are people entering.
- In 2018, vacancy rates for lab positions in the U.S. ranged from about 6-11%, depending on the region. During the same year, the demand for lab workers grew by 13%, which was double the average growth for other U.S. occupations.
- The impact of the worker shortage was seen clearly during COVID as experts indicated that "a shortage of lab workers to process diagnostic tests is the biggest obstacle to the U.S. increasing its testing capacity."
Reduced Reimbursements
- It was reported in early 2020 that for 3 straight years Medicare had reduced the fees for many of the most common laboratory tests. The result of this was "an unprecedented 30% cut in CLFS payment rates for the most common laboratory tests over a three-year period."
- Additionally, insurers are making changes to their reimbursement rates, and often creating networks of "preferred providers" that encourage patients to use certain services due to lower costs. Often these agreements are made with labs that agree to lower reimbursement rates in return for the higher volume they expect to see. Examples of insurers that have implemented one of both of these strategies are UnitedHealthcare and Anthem.
- For 2021, Medicare reduced lab reimbursements by 5%. This continued downward pressure on reimbursements could mean labs will have to find ways to cut costs in order to continue to grow.
- Since the reductions in reimbursements is an ongoing issue, labs can prepare for it by making changes. Surveys on the impact of the reductions have shown that labs have both reduced services and reduced staffing in order to counteract the lower rates. However, by planning ahead, companies can improve their financial discipline, add specializations, improve efficiency, and focus on contract negotiations with hospitals as ways to continue to increase revenue even while facing reduced reimbursements.
Supply Shortages
- "Clinical laboratories are facing problems due to widespread shortages of test kits, specimen collection materials, and personal protective equipment (PPE)."
- While reported shortages of supplies for COVID-related tests were not surprising, the supply chain for supplies and equipment unrelated to COVID have also been disrupted. If labs don't have the supplies they need, tests can't be completed and the bottom line will be impacted.
- Examples of supplies that are in short supply are "culture and transport media, swabs, pipettes, pipette tips and collection tubes."
- With much of the supply chain for equipment and supplies being global, the pandemic had an outsized impact because global transportation and shipping was disrupted. Fixing the problem may require companies to rethink their supply chains, and begin to focus on local resources that may be less impacted by global disruptions.
- This resource has many graphs and charts that demonstrate the impact supply shortages have had on labs. Unfortunately, they were not formatted in a way that allowed them to be presented directly in this report.
Reports Available for Purchase
- Since much of the data requested specific to the U.S. was behind paywalls (specifically the CAGR and the breakdown of revenue by provider type), links to several reports available for purchase are being included. Most of these reports are global reports that have a section on NA, the US or both. Any reports that are specific to the US only are noted.
- Mordor Intelligence - pricing from $4,250
- Global Market Insights - pricing from $5,150
- Grand View Research - pricing from $5,950
- Reports and Data - pricing from $4,590
- Kalorama Information - this report is a US focus and pricing starts at $1,995.
Research Strategy
In order to find data on the breakdown of the US market by end users (hospitals, physicians offices, and stand-alone labs) and the predicted CAGR for the next 3-5 years, we searched through numerous market reports which allowed us to find the data at a global level, but not for the US. We also looked for reports published by the US government as these would generally focus specifically on the US only. While this allowed us to find some relevant, slightly older data published on the CMS website, it did not provide all the requested details. When researching market size, CAGR, and the provider breakdown, we focused on both the US and North America, as we knew it was possible that data for the US only would not be publicly available. Since much of the data found from many reputable sources was varied, we included multiple data points in order to provide a broader view of how experts view the market in both the US and Canada. Ultimately, the CAGR for the US going forward was not found publicly available.


