Part
01
of one
Part
01
Cash Flow's Impact on Profitability (2)
Through in-depth research using company consolidation databases such as Crunchbase, as well as investments sites including Zacks and The Motley Fool, we were able to identify four public companies that met the criteria of operating in the CPG space, having a significant portion of their sales from direct-to-consumer or ecommerce, and a strong cash on hand position. Additionally, each of these companies also reported positive revenue growth, strong gross profit, and/or consistent profitability. For each of these companies, financial data was provided, along with publicly available details on their inventory turnover ratio and inventory practices. The companies included are Lululemon, Designer Shoe Warehouse, Wayfair, and Stitch Fix.
Since only four companies that met the given criteria were found, we expanded the criteria to include public CPG companies that met all the criteria except possibly strong ecommerce sales. With the expanded search criteria, we identified two additional companies, Monster Beverage and Walmart. While both companies do have ecommerce sales, we were able to confirm that only about 10% of Walmart's sales are attributable to ecommerce, and Monster does not disclose what portion of its sales come from ecommerce. However, both companies have strong cash on hand positions and have increasing revenue, so they were included to add additional insights to the report.
Finally, two best practices improving inventory turnover rates are reducing or limiting the number of items offered and utilizing multi-echelon inventory optimization. Details on both are provided below.
Direct-to-Consumer and/or Strong Ecommerce Companies
Lululemon
- Lululemon has had positive cash flow in all but one of the last four years. Cash increased by $233.4 million in FY 2017, increased by $255.7 million in FY 2018, decreased by $109.2 million in FY 2019, and increased by $212.2 million in FY 2020. The company's cash and cash equivalents reported in the annual report for FY ending February 2, 2020, was $1,093.5 million.
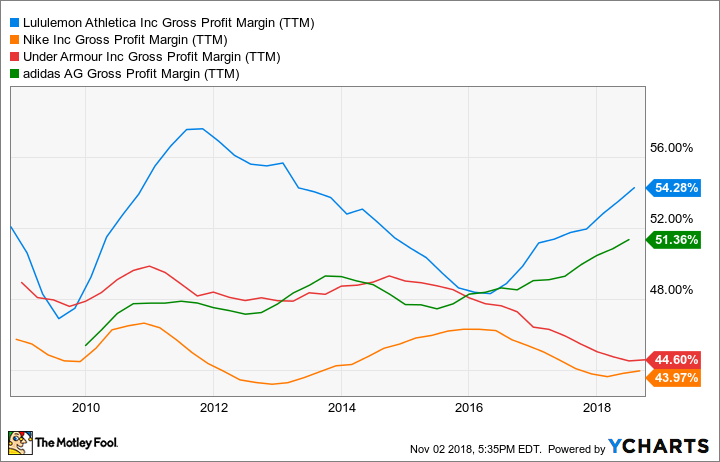
- The company has a "tight supply approach to merchandising." This means they purposely limit inventory in order to drive demand. The most common way this happens is tied into collaborations with brands and/or celebrities. They produce limited inventory of pieces they expect to be in high demand. This strategy has resulted in a faster inventory turnover than that achieved by other athletic brands. The following chart compares the inventory for Lululemon to three other large athletic companies from 2010 through 2018.

- Both revenue and gross profit have been consistently increasing for Lululemon, with revenue moving from $2,060.5 million in FY 2016 to $3,979.3 million in FY 2020. Similarly, gross profit went from $997.2 million in 2016 to $2,223.4 million in 2020.
- According to reporting by finbox.com, the average inventory for Lululemon has been increasing since at least 2016. During that time, the inventory turnover rate has ranged between 3.8 and 4.3. While it has not been a steady decrease, the highest turnover was found as of 1/31/2016, and the lowest as of 2/2/2020.
- The Motley Fool reported on Lululemon's growth and specifically focused on inventory turnover, return on invested capital, and gross margin. The data on inventory turnover was the same as that presented in the image above. The primary reasons for the company's success, according to the Fool, are very limited quantities (which can make items seem more valuable to consumers), limited edition pieces, refreshing core styles regularly, and maintaining a smaller line of product categories than many competitors.
- Lululemon also has consistently had higher gross margin levels than its peers, as can be seen in the following graph.
Designer Shoe Warehouse (DSW)
- Partially as a result of the pandemic, Designer Brands, the parent company of DSW, announced that 50% of demand for the first quarter of 2020 (which ended May 2, 2020) was from digital channels. Although this is not entirely attributable to DSW, as one of only four brands owned by Designer Brands, it is likely that e-commerce sales were also a large portion of DSW sales. Unfortunately, the company does not break out sales by platform in their annual report or other financial reports that were examined.
- Even with the lack of data to confirm what portion of DSW's sales come from ecommerce, their unique way of handling inventory, along with financial data for Designer Brands demonstrating a positive cash position, positive revenue growth and strong gross profit, a decision was made to include the company in this analysis.
- From 2015 to 2019, Designer Brands revenue increased from $2.6 billion to $3.5 billion, while gross profit increased from $768.4 million to $999.7 million. While cash, cash equivalents, and investments had decreased over the past few years. Designer Brands still had $111.5 million as of 2019. The company reported that cash and investments were $250.9 million at the end of the first quarter of 2020, which was more than double the amount from the previous year's first quarter.
- Zacks reports that the inventory turnover ratio for Designer Brands was 3.75 as of 1/31/20, 3.75 as of 4/30/20, and 3.93 as of 7/31/20.
- DSW "uses its shop floors to both display and store its product." However, even this strategy did not make the company immune for the move to more online sales. As a result, DSW moved to a model where more than half of online orders are fulfilled by stores rather than through a central warehouse. This is both cost effective, and also helps with inventory management as shoppers choose to purchase online rather than in-store.
- Of note, DSW is now reversing an earlier decision they made on increasing the number of brands and SKUs offered. While the company worked with 580 vendors in 2019, they announced in 2020 that they would be focusing on the top 50 brands. The hope is that this may result in reduced prices for consumers as the company benefits from buying more product from a limited number of brands
Wayfair
- Wayfair sells a variety of products, many of which fall into the consumer packaged goods category. Examples include kitchen items, bed & bath, and decor.
- Wayfair's cash and cash equivalents have increased from $466 million in 2015 to $1.1 billion in 2019. Revenue also increased, going from $4.7 billion in 2017 to $9.1 billion in 2019. Based on this data, and the fact that the company is public and primarily sells through ecommerce (they only have one retail location and one outlet store), they meet the criteria to be included in this analysis.
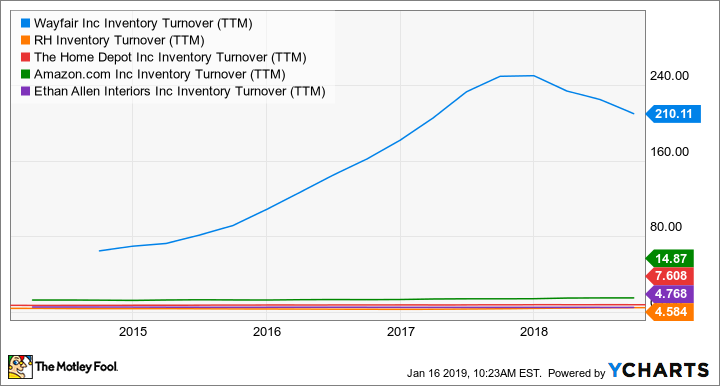
- An analysis of Wayfair by The Motley Fool includes a chart that compares inventory turnover for Wayfair to that of other companies in a similar space, such as Home Depot and Amazon. This chart makes clear that Wayfair's inventory rate is more than 10 times as great as the nearest competitor examined.
- According to the company's annual report, they are able to hold minimal inventory because they expect their suppliers to take on some roles that have traditionally been done by retailers themselves. These roles include "maintaining inventory and preparing merchandise for shipment" to customers.
- At the core of Wayfair's inventory management is data communication and analysis. "Suppliers upload information regarding their stock to the server. An algorithm uses the inventory data, defines the best way to ship an item depending on location and product characteristics, and calculates the shipping time in order to ultimately enable an order fulfillment with a 98% success rate."
Stitch Fix
- Stitch Fix has a team of stylists that pick clothing for customers based on surveys the customers complete. Customers then have the option of keeping or returning the items once they have an opportunity to try them on.
- From 2015 through 2019 the company had the following cash or cash equivalents: $68.5 million in 2015, $91.5 million in 2016, $110.6 million in 2017, $297.5 million in 2018, and $196.5 million in 2019. The decrease in 2019 was primarily due to a one-off capital investment. Revenue also increased from $342 million in 2015 to $1.6 billion in 2019.
- Zacks reports that the inventory turnover rate for the company was 7.32 as of 1/31/20, 6.60 as of 4/30/20, and 6.54 as of 7/31/20. MHE consumer confirms that this turnover rate of more than 6 is excellent and a strength.
- Stitch Fix uses an algorithm to manage inventory. In December 2019, the company sent a letter to shareholders and one of the areas highlighted was improvements being made to the inventory algorithm. According to the letter the algorithm "pushed up key engagement metrics including client spending and satisfaction."
- Mike Smith, COO and President of Stitch Fix, said in early 2019 that the changes to the inventory algorithm involved moving from optimizing inventory one client at a time to looking at the overall customer population. Although specifics on how the algorithm was changed were not found publicly, Smith did report that the changes appeared to increase "client satisfaction, the number of items purchased per fix and the average order value."
- Due to their operating model, Stitch Fix likely has a larger number of returns than the typical clothing retailer. They discussed this in the 2019 annual report and highlighted that processes are in place to ensure the process happens seamlessly. "Our specialist returns teams in our dedicated return intake areas accept, process, and reallocate returns to our inventory so the merchandise can be selected for another Fix. Our expertise in inventory management allows us to turn inventory quickly, which drives working capital efficiency. "
CPG Company with Unconfirmed Ecommerce Sales
Monster Beverage Corporation
- Monster Beverage Corporation, as the name suggests, is primarily made up of companies that sell beverages. According to their annual report, distribution channels include "full service beverage bottlers/distributors, retail grocery and specialty chains, wholesalers, club stores, mass merchandisers, convenience chains, foodservice customers, value stores, ecommerce retailers and the military."
- For 2019, club stores, mass merchandisers, and ecommerce retailers accounted for 7% of Monster's customers, up from 6% in 2018.
- As of 12/31/18, Monster had $637.5 million in cash and cash equivalents, and this increased to $798.0 million in 2019.
- Net sales have been increasing since at least 2017, with sales of $3.4 billion in 2017, $3.8 billion in 2018, and $4.2 billion in 2019. Gross profit also increased with an increase of 7.4% from 2017 to 2018 and 9.7% from 2018 to 2019.
- According to finbox.com, Monster's inventory turnover rate was 6.6 at the end of 2015, 7.0 for 2016, 5.9 for 2017, 5.7 for 2018, and 5.3 for 2019.
- Monster reported in their 2019 report that the reduction of inventory days on hand has been and will continue to be an area of focus for the company. Purchases of inventories is expected to be one of the primary uses of cash on hand.
- The company had a significant increase in inventories from 2018 ($277.7 million) to 2019 ($360.7 million) but no explanation was given. This was an increase of 29.9% [(360.7-277.7)/277.7*100], which was significantly larger than the increase in revenue of 10.5% [(4.2-3.8)/3.8*100].
- Unfortunately we were not able to find any public reporting on Monster's approach to inventory management.
- One strategy Monster used to grow was to form a partnership with Coca-Cola which allows them to use the distribution platform. Monster manages Coke's energy drinks, while Coke manages Monster's non-energy drink products. Coke owns 17% of Monster which gives them both representation and incentive to move the partnership forward.
Walmart
- In 2019, online sales accounted for about 8% of Walmart's total sales. This was expected to increase to 11% for 2020. However, the pandemic likely pushed that number even higher as Walmart reported online sales in the 2nd quarter increased by 97%. So although much of the financial data for the company will not be specific to their ecommerce business, it does account for a significant portion of sales overall.
- On 1/31/20, Walmart had $9.5 billion in cash on hand, compared to $7.7 billion on 1/31/19.
- Walmart's revenue increased from $482.1 billion in FY 2016 to $524.0 billion in FY 2020. During that same time period, gross profit margin has stayed relatively consistent, ranging between 24.1% and 24.9%.
- A 2019 article by Investopedia reported that Walmart's inventory turnover rate was 8.53, compared to 7.43 for the sector overall.
- One way Walmart manages inventory is by dealing directly with manufacturers. Additionally, the company has a system where the suppliers are responsible for managing their own inventory. This significantly reduced the workload for Walmart and helped ensure that items would always be in stock.
- Another inventory strategy used by Walmart is cross-docking. "It means the direct transfer of products from inbound or outbound truck trailers without the need for extra storage, by unloading items from an incoming semi-trailer truck or railroad car and loading these materials directly into outbound trucks, trailers, or rail cars (and vice versa), with no storage in between."
- Walmart categorizes inventory into three categories, A, B, and C, and each type of inventory is managed differently. A items are mainly finished goods they sell and these items require the greatest amount of monitoring.
Companies considered but not included
Beyond Meat
- Beyond Meat sells plant-based meat alternatives which would put them in the CPG space. While the company only went public in May 2019, the 2019 annual report provides financial data from 2016.
- Although the company had a strong cash on hand position as well as revenues that have continued to increase since 2016, they only recently launched an ecommerce site so did not meet the criteria of having a large ecommerce presence.
Duluth Holdings
- Duluth Trading, owned by Duluth Holdings, sells clothing, much of it aimed at people working and playing outdoors.
- Their annual report for 2019 indicated that more than half of their revenue came from direct sales.
- A further examination of their annual report uncovered that although the company has seen increasing revenues, they did not have a strong cash position, with $538 thousand cash on hand as of February 2, 2020, about $200 thousand less than they had at the same time in 2019. Therefore, they were not included.
Chewy
- Chewy is a public company that sells pet supplies directly to consumers. However, an examination of their annual report found that although revenue has increased since 2017, the company does not have a strong cash position. In 2019, as with previous years, they had negative cash on hand.
Best Practices improving Inventory Turnover
Reduce the Quantity of Items Offered
- The 2018 Forecasting and Inventory Benchmark Study examines practices and outcomes in inventory and "encompasses over $250 billion in annual sales from global manufacturers across a variety of industries, including food and beverage, consumer packaged goods, industrial manufacturing, chemicals, and oil and gas."
- The 2018 study found that 10% of items in inventory generate 79% of volume, while "the slowest-moving 50% of items generate less than 0.5% of all volume." Based on these statistics, it is likely companies could cut most of the slowest moving items without having a significant impact on sales.
- To further illustrate this point, the study found that 89% of items were in the "tail" of inventory, the slowest moving items, and only accounted for 20% of sales. "This demonstrates again that a huge amount of complexity and cost is driven by a small portion of the business."
- Based on data collected by this study from 2010, it was found that no item that was a slow mover during the first two years after being introduced ever became a top performer. So although innovation is important, it is equally important to remove products that do not become strong sellers in a year or two. Much of the complexity of managing inventory comes from having many SKUs, so anything a company can do to eliminate the poor performing SKUs can potentially reduce costs and improve performance.
- Deloitte calls this SKU rationalization and says companies can initially focus on finding SKUs that are very similar or offer the same benefits to customers.
- Examples of CPG companies that use this strategy, and have even accelerated the practice during the pandemic, are Mondelez, General Mills, Coca-Cola, and Procter & Gamble.
- From the companies analyzed above, Lululemon appears to follow the practice of keeping the number of SKUs low, which means they likely have fewer items in the "tail" and don't need to cull inventory as often as other companies.
Utilizing Multi-Echelon Inventory Optimization (MEIO)
- "Single-echelon inventory control problems focus on determining the appropriate level of inventory for an individual unit within the supply chain network, while multi-echelon inventory optimisation takes a holistic approach by focusing on the correct levels of inventory across the entire network."
- The 2018 Forecasting and Inventory Benchmark Study found that compared to a single-echelon inventory control system, using MEIO with demand planning reduced safety stock days by 13%. When MEIO was combined with demand sensing practices, the reduction in safety days was 31%. In both cases there is a clear advantage to using MEIO over traditional single-echelon systems.
- The findings of the Benchmark Study were also supported by a 2016 study titled 'Comparison of single-echelon vs. multi-echelon inventory systems using multi-objective stochastic modelling.' "The results show that single-echelon systems result in higher inventory levels and lower fill rates, while multi-echelon systems result in lower inventory levels while maintaining higher fill rates for the entire supply chain network."