Part
01
of one
Part
01
Cannabis Retailer Scorecard, Part 2: Ajax / Napanee
Key Takeaways
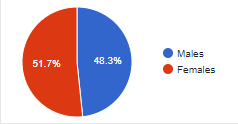
- In 2016, there were 57,865 males and 61,815 females in Ajax. Males comprised 48.3% and females comprised 51.7% of the total population of Ajax.
- In 2016, the median total household income in Ajax was $96,949 per year. The median household income after tax was $83,633 per year.
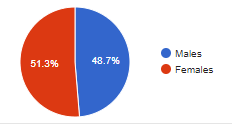
- In 2016, there were 7,735 males and 8,155 females in Greater Napanee. Males comprised 48.7% and females comprised 51.3% of the total population of Greater Napanee.
- In 2016, 6,910 people out of a total adult (aged 15 years and above) population of 13,560 people in Greater Napanee were married. Thus, 50.96% of the total adult population of Greater Napanee was married.
Introduction
Statistics Canada is the national statistical agency of Canada. It conducts the census in the country every five years. "The collection phase of the 2021 census" has been completed and Statistics Canada has not published the results of the census at the time of writing this research brief. Hence, the 2016 census has been considered while preparing this research brief. Demographic profiles of residents of Ajax and Greater Napanee, two towns in the Canadian province of Ontario, have been provided in the research brief below. Since Napanee is only the population center of the larger town of Greater Napanee, we have considered Greater Napanee while preparing this research brief. Also, since Greater Napanee is the county seat of Lennox and Addington County, certain demographic data pertaining to Lennox and Addington County has been considered as a suitable proxy wherever the said data for Greater Napanee was not available.
Demographic Profile of Residents in Ajax
Gender
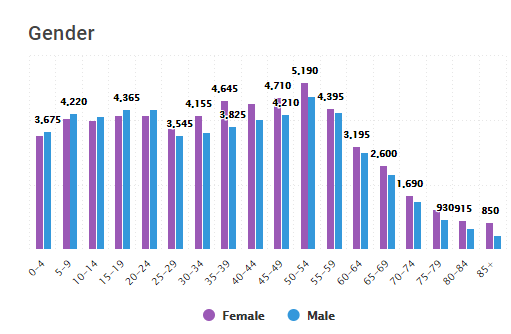
- In 2016, there were 57,865 males and 61,815 females in Ajax. Males comprised 48.3% and females comprised 51.7% of the total population of Ajax.
- While males outnumbered females in the age group 0-24 years, the trend reversed for ages 25 years and above.
Common Occupations
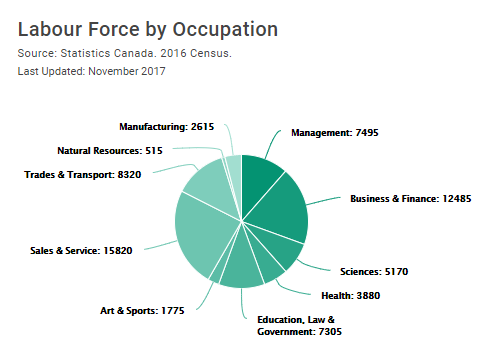
- In 2016, 65,380 people were in the labor force by occupation in Ajax. Out of this, 59,520 people were employed by companies while 5,860 people were self-employed. 28,130 people aged 15 years and above were not in the labor force.
- Participation rate represents "the percentage of people who are either employed or are actively looking for work." In 2016, the participation rate in Ajax was 70.6%. While the employment rate was 64.8%, the unemployment rate was 8.2%.
- The breakdown of the labor force by occupation in 2016 was as follows:
- Management: 7,495 people.
- Business and finance: 12,485 people.
- Natural and applied sciences: 5,170 people.
- Health: 3,880 people.
- Education, law, social, and governmental services: 7,305 people.
- Arts, culture, and sports: 1,775 people.
- Sales and services: 15,820 people.
- Trades and transport: 8,320 people.
- Natural resources and agriculture: 515 people.
- Manufacturing and utilities: 2,615 people.
Political Views
- Since 2015, the Liberal Party of Canada has been the most favored political party among residents of Ajax. Mark Holland, the Liberal Party candidate, has won each of the general elections held in 2015, 2019, and 2021. In each of these elections, the Conservative Party of Canada has come second and the New Democratic Party has come third.
- In the 2015 general election, Mark Holland received 55.9% of the total votes in Ajax. His competitors Chris Alexander of the Conservative Party and Stephanie Brown of the New Democratic Party received 34.4% and 8.2% of the total votes, respectively.
- In the 2019 general election, Mark Holland received 57.7% of the total votes in Ajax. His competitors Tom Dingwall of the Conservative Party and Shokat Malik of the New Democratic Party received 26.0% and 11.5% of the total votes, respectively.
- In the 2021 general election, Mark Holland received 56.8% of the total votes in Ajax. His competitors Arshad Awan of the Conservative Party and Monique Hughes of the New Democratic Party received 26.6% and 14.0% of the total votes, respectively.
Religious Views
- Statistics Canada reports the religious affiliation of residents once every ten years through its National Household Survey results. The last National Household Survey data was released in 2011.
- According to the 2011 National Household Survey, Christianity was the largest religion in Ajax with 66.64% of residents in Ajax professing Christianity [Calculation: (72,780/109,220)*100 = 66.64%]. The Catholic group was the largest group among Christians with Catholics making up 31.22% of the entire resident population of Ajax [Calculation: (34,100/109,220)*100 = 31.22%].
- The percentage of Ajax residents professing other religions or not having any religious affiliation in 2011 was as follows:
- Islam: 6.91% [Calculation: (7,550/109,220)*100 = 6.91%].
- Hinduism: 5.94% [Calculation: (6,490/109,220)*100 = 5.94%].
- Buddhism: 0.71% [Calculation: (780/109,220)*100 = 0.71%].
- Sikhism: 0.54% [Calculation: (590/109,220)*100 = 0.54%].
- Judaism: 0.38% [Calculation: (410/109,220)*100 = 0.38%].
- Other religions: 0.23% [Calculation: (250/109,220)*100 = 0.23%].
- No religious affiliation: 18.65% [Calculation: (20,365/109,220)*100 = 18.65%].
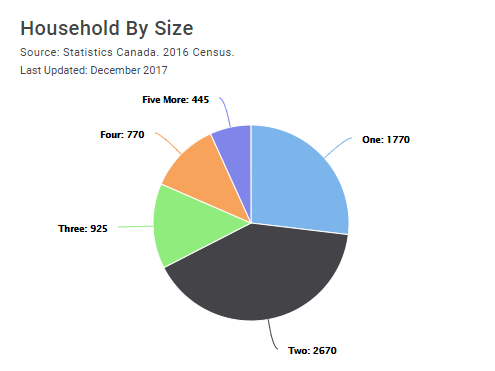
Number of People Per Household
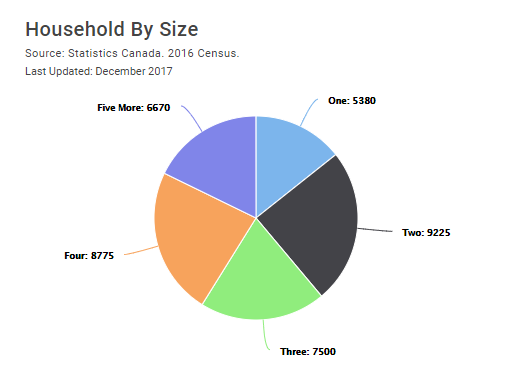
- In 2016, the average household size in Ajax was 3.2 people.
- The number of households according to household size was as follows:
Number of Children Per Household
- In 2016, there were 8,580 couples without children and 18,840 couples with children in Ajax.
- Among the couples with children, the distribution of children was as follows:
- 1 child: 6,455 couples.
- 2 children: 8,525 couples.
- 3 or more children: 3,860 couples.
- There were 6,440 families having lone parents with children in Ajax in 2016. The distribution of children was as follows:
Ethnicity
- According to Statistics Canada, "ethnic origin refers to the ethnic or cultural origins of the person's ancestors." The ethnic profile of the residents in Ajax in 2016 was as follows:
- Aboriginal identity: 1.00% [Calculation: (1,190/119,180)*100 = 1.00%].
- Whites: 42.33% [Calculation: ((51,640-1,190)/119,180)*100 = 42.33%].
- South Asian: 20.89% [Calculation: (24,895/119,180)*100 = 20.89%].
- Black: 16.66% [Calculation: (19,860/119,180)*100 = 16.66%].
- Chinese: 2.85% [Calculation: (3,400/119,180)*100 = 2.85%].
- Filipino: 4.77% [Calculation: (5,685/119,180)*100 = 4.77%].
- Southeast Asian: 0.56% [Calculation: (665/119,180)*100 = 0.56%].
- West Asian: 2.43% [Calculation: (2,900/119,180)*100 = 2.43%].
- Arab: 1.66% [Calculation: (1,980/119,180)*100 = 1.66%].
- Latin American: 1.40% [Calculation: (1,670/119,180)*100 = 1.40%].
- Korean: 0.15% [Calculation: (175/119,180)*100 = 0.15%].
- Japanese: 0.18% [Calculation: (215/119,180)*100 = 0.18%].
- Multiple visible minorities: 5.11% [Calculation: ((3,185+2,910)/119,180)*100 = 5.11%].
Household Income
- In 2016, the median total household income in Ajax was $96,949 per year. The median household income after tax was $83,633 per year.
- The household income distribution in Ajax in 2016 was as follows:
- Income under $5,000: 250 households.
- $5,000 to $9,999: 245 households.
- $10,000 to $14,999: 365 households.
- $15,000 to $19,999: 590 households.
- $20,000 to $24,999: 780 households.
- $25,000 to $29,999: 800 households.
- $30,000 to $34,999: 910 households.
- $35,000 to $39,999: 1,050 households.
- $40,000 to $44,999: 1,040 households.
- $45,000 to $49,999: 1,140 households.
- $50,000 to $59,999: 2,330 households.
- $60,000 to $69,999: 2,605 households.
- $70,000 to $79,999: 2,370 households.
- $80,000 to $89,999: 2,530 households.
- $90,000 to $99,999: 2,480 households.
- $100,000 to $124,999: 5,425 households.
- $125,000 to $149,999: 4,170 households.
- $150,000 to $199,999: 4,835 households.
- $200,000 and above: 3,630 households.
Household Spending
- According to a survey conducted by Statistics Canada, the average yearly household spending among residents across the province of Ontario in 2019 was $71,876. The average share of spending across categories was as follows:
- According to the 2016 census released by Statistics Canada, 72.6% of the total households in Ajax spent less than 30% on housing, while 27.4% of the total households spent 30% or more on housing.
- Among owner households, the percentage spending less than 30% on housing and the percentage spending 30% or more on housing was 75.2% and 24.8%, respectively. Among tenant households, the corresponding percentages were 56.6% and 43.4%, respectively.
Marital Status
- In 2016, 50,495 people out of a total adult (aged 15 years and above) population of 96,015 people in Ajax were married. Thus, 52.59% of the total adult population of Ajax was married.
- The marital status of the rest of the adult population in Ajax in 2016 was as follows:
Demographic Profile of Residents in Greater Napanee
- Greater Napanee includes the smaller communities of Napanee, Adolphustown, Forest Mills, North & South Fredericksburgh, Selby, and Roblin.
- The county seat of Lennox and Addington County in Ontario is Greater Napanee.
Gender
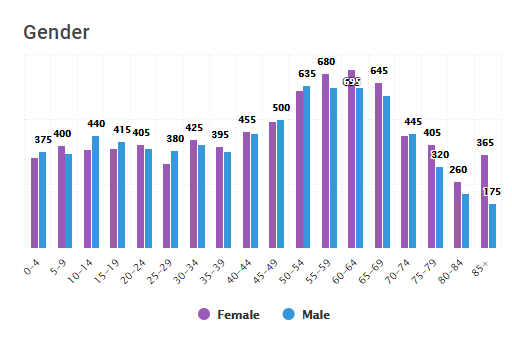
- In 2016, there were 7,735 males and 8,155 females in Greater Napanee. Males comprised 48.7% and females comprised 51.3% of the total population of Greater Napanee.
- While females outnumbered males by 410 people overall, the largest difference between females and males was in the age group 85 years and above (365 females vs. 175 males).
Common Occupations
- In 2016, 7,295 people were in the labor force by occupation in Greater Napanee. Out of this, 6,455 people were employed by companies while 845 people were self-employed. 5,605 people aged 15 years and above were not in the labor force.
- Participation rate represents "the percentage of people who are either employed or are actively looking for work." In 2016, the participation rate in Greater Napanee was 56.9%. While the employment rate was 53.5%, the unemployment rate was 6.0%.
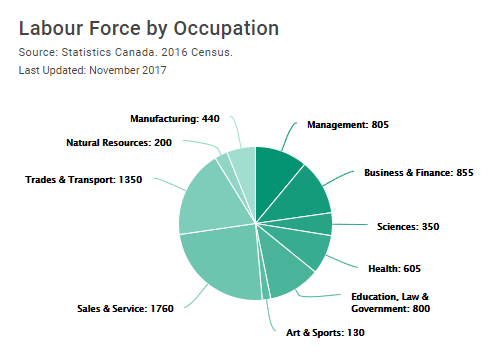
- The breakdown of the labor force by occupation in 2016 was as follows:
- Management: 805 people.
- Business and finance: 855 people.
- Natural and applied sciences: 350 people.
- Health: 605 people.
- Education, law, social, and governmental services: 800 people.
- Arts, culture, and sports: 130 people.
- Sales and services: 1,760 people.
- Trades and transport: 1,350 people.
- Natural resources and agriculture: 200 people.
- Manufacturing and utilities: 440 people.
Political Views
- Since Greater Napanee is the county seat of Lennox and Addington County, the website of Elections Canada does not report about the election results in Greater Napanee. However, it reports about the election results in Lennox and Addington County. Considering the same, Lennox and Addington County has been considered as a suitable proxy for Greater Napanee.
- While the Liberal Party of Canada was the most favored political party in the 2015 general election in the county, the Conservative Party of Canada emerged as the most favored political party in the 2019 and 2021 general elections. The New Democratic Party has come third in each of these elections.
- In the 2015 general election, Mike Bossio of the Liberal Party received 42.4% of the total votes in the county. His competitors Daryl Kramp of the Conservative Party and Betty Bannon of the New Democratic Party received 41.9% and 12.7% of the total votes, respectively.
- In the 2019 general election, Derek Sloan of the Conservative Party received 41.4% of the total votes in the county. His competitors Mike Bossio of the Liberal Party and David Tough of the New Democratic Party received 37.1% and 13.2% of the total votes, respectively.
- In the 2021 general election, Shelby Kramp-Neuman of the Conservative Party received 45.1% of the total votes in the county. His competitors Mike Bossio of the Liberal Party and Matilda DeBues of the New Democratic Party received 34.9% and 11.0% of the total votes, respectively.
Religious Views
- Statistics Canada reports the religious affiliation of residents once every ten years through its National Household Survey results. The last National Household Survey data was released in 2011.
- The 2011 National Household Survey has no information about the town of Greater Napanee. However, it has information about Lennox and Addington County. Hence, the religious demographic of the residents of Lennox and Addington County has been considered as a suitable proxy for the religious demographic of the residents of Greater Napanee.
- Christianity was the largest religion in the county with 72.47% of residents professing Christianity [Calculation: (65,295/90,105)*100 = 72.47%]. The two largest groups among Christians were the United Church group and Catholics comprising 20.78% and 20.42%, respectively, of the entire resident population of the county [Calculations: (18,725/90,105)*100 = 20.78% and (18,400/90,105)*100 = 20.42%].
- The percentage of residents in the county professing other religions or not having any religious affiliation in 2011 was as follows:
- Buddhism: 0.20% [Calculation: (180/90,105)*100 = 0.20%].
- Hinduism: 0.04% [Calculation: (35/90,105)*100 = 0.04%].
- Islam: 0.12% [Calculation: (110/90,105)*100 = 0.12%].
- Judaism: 0.12% [Calculation: (110/90,105)*100 = 0.12%].
- Sikhism: 0.02% [Calculation: (20/90,105)*100 = 0.02%].
- Traditional (aboriginal) religion: 0.13% [Calculation: (120/90,105)*100 = 0.13%].
- Other religions: 0.30% [Calculation: (270/90,105)*100 = 0.30%].
- No religious affiliation: 26.6% [Calculation: (23,965/90,105)*100 = 26.6%].
Number of People Per Household
- In 2016, the average household size in Greater Napanee was 2.3 people.
- The number of households according to household size was as follows:
Number of Children Per Household
- In 2016, there were 2,395 couples without children and 1,695 couples with children in Greater Napanee.
- Among the couples with children, the distribution of children was as follows:
- There were 660 families having lone parents with children in Greater Napanee in 2016. The distribution of children was as follows:
Ethnicity
- According to Statistics Canada, the ethnic profile of the residents in Greater Napanee in 2016 was as follows:
- Aboriginal identity: 5.34% [Calculation: (820/15,360)*100 = 5.34%].
- Whites: 92.25% [Calculation: ((14,990-820)/15,360)*100 = 92.25%].
- South Asian: 0.46% [Calculation: (70/15,360)*100 = 0.46%].
- Black: 0.55% [Calculation: (85/15,360)*100 = 0.55%].
- Chinese: 0.39% [Calculation: (60/15,360)*100 = 0.39%].
- Filipino: 0.39% [Calculation: (60/15,360)*100 = 0.39%].
- Arab: 0.13% [Calculation: (20/15,360)*100 = 0.13%].
- Latin American: 0.36% [Calculation: (55/15,360)*100 = 0.36%].
- Multiple visible minorities: 0.13% [Calculation: (20/15,360)*100 = 0.13%].
Household Income
- In 2016, the median total household income in Greater Napanee was $64,213 per year. The median household income after tax was $57,242 per year.
- The household income distribution in Greater Napanee in 2016 was as follows:
- Income under $5,000: 45 households.
- $5,000 to $9,999: 60 households.
- $10,000 to $14,999: 240 households.
- $15,000 to $19,999: 285 households.
- $20,000 to $24,999: 370 households.
- $25,000 to $29,999: 320 households.
- $30,000 to $34,999: 325 households.
- $35,000 to $39,999: 305 households.
- $40,000 to $44,999: 305 households.
- $45,000 to $49,999: 295 households.
- $50,000 to $59,999: 540 households.
- $60,000 to $69,999: 540 households.
- $70,000 to $79,999: 505 households.
- $80,000 to $89,999: 385 households.
- $90,000 to $99,999: 380 households.
- $100,000 to $124,999: 675 households.
- $125,000 to $149,999: 430 households.
- $150,000 to $199,999: 405 households.
- $200,000 and above: 185 households.
Household Spending
- According to a survey conducted by Statistics Canada, the average yearly household spending among residents across the province of Ontario in 2019 was $71,876. The average share of spending across categories was as follows:
- According to the 2016 census released by Statistics Canada, 74.7% of the total households in Greater Napanee spent less than 30% on housing, while 25.3% of the total households spent 30% or more on housing [Calculation: (4,785/6,405)*100 = 74.7% and (100%-74.7% = 25.3%)].
- Among owner households, the percentage spending 30% or more on housing and the percentage spending less than 30% on housing was 15.9% and 84.1%, respectively. Among tenant households, the corresponding percentages were 51.9% and 48.1%, respectively.
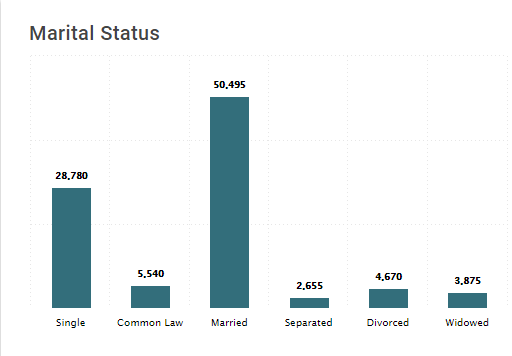
Marital Status
- In 2016, 6,910 people out of a total adult (aged 15 years and above) population of 13,560 people in Greater Napanee were married. Thus, 50.96% of the total adult population of Greater Napanee was married.
- The marital status of the rest of the adult population in Greater Napanee in 2016 was as follows:

Research Strategy
For creating a demographic profile of the residents of Ajax and Greater Napanee, two towns in the Canadian province of Ontario, we have leveraged census reports and other official reports released by Canadian governmental agencies like Statistics Canada and Elections Canada. We have also leveraged databases like Townfolio and City Population. While we have endeavored to provide the latest demographic data, our research has revealed that the most recent Canadian census report was released by Statistics Canada in 2016. Information related to the religious affiliation of residents was found to be even older, released by Statistics Canada in its National Household Survey in 2011. Information related to the political affiliation of residents was obtained from reports of the general elections held in 2015, 2019, and 2021 released by Elections Canada.
While all required information for the town of Ajax was found in the above sources, we had to expand our scope to include the larger town of Greater Napanee since information for Napanee was limited. However, for a few demographic parameters like political views and religious views, there was limited information for even Greater Napanee. Hence, we had to expand our scope further to include Lennox and Addington County whose county seat is Greater Napanee. The said demographic data for the residents of Lennox and Addington County can be considered as a suitable proxy for the residents of Greater Napanee as well.