Part
01
of one
Part
01
Metropolitan Markets Most Affected by Hail Storms
Key Takeaways
- Omaha, NE had the highest number of hail loss claims in the three-year period (2017-2019), with 54,153 such claims.
- San Antonio experienced the most significant growth in hail loss claims, with a 457% increase between 2015-2017 and 2018-2020, when it had 27,000 such claims.
- Colorado Springs ranked third for the most hail loss claims for the period 2017-2019 (with 38,044) and first for the period 2018-2020 (with 47,000).
- Texas has the highest number of cities that are featured among those with the most hail loss claims. Those cities are McKinney, Dallas, Frisco, Lubbock, Odessa, San Antonio, Fort Worth, Houston, and Arlington.
Introduction
The report presents 16 cities in the US that are the most affected by hail storms, including Omaha, NE, Denver, CO, Colorado Springs, CO, McKinney, TX, Dallas, TX, Frisco, TX, Greeley, CO, Lakewood, CO, Lubbock, TX, Odessa, TX, San Antonio, TX, Fort Worth, TX, Rapid City, SD, Houston, TX, Arlington, TX, and Chicago, IL. The information has been provided both in the report below and in the attached spreadsheet.
Omaha, NE
- Omaha had 18,199 hail loss claims in 2019 and no more than 1,000 in 2020. Between 2017 and 2019, the city recorded 54,153 such claims. In that period, it was the US city with the highest number of hail loss claims.
- US Census reports the median household income at $60,092. World Population Review puts the average (mean) income at $82,945.
- The percentage of owner-occupied housing units is 58.6%, with 41.4% being renter-occupied.
- Omaha's total population is 486,051.
- Omaha's economic growth between 2001 and 2017 was 1.22%. While it hasn't been measured since then, it was forecast to grow at a rate of 1% (based on the available data and calculations done with a CAGR calculator).
- The current job growth rate is 6.19%.
- Omaha-Council Bluffs Metro Area ranked 118th on the 2020 list of US metro areas investing the most in new housing by Construction Coverage. There were 4,066 new housing units and 43.2 new units per 10,000 residents. 34.9% of new units are multi-family.
- In November 2019, Omaha has been named the fastest-growing construction job market by The Associated General Contractors. It added 5,900 jobs between October 2018 and October 2019.

Denver, CO
- Denver had 12,857 hail loss claims in 2019 and around 1,500 in 2020. The total number of such claims between 2017 and 2019 was 51,887, which makes it the city with the second-highest number of hail loss claims in the US in that period.
- The average household income in Denver is $99,151, while the median household income is $68,592.
- Owner-occupied units account for 49.9% of all housing units, while renter-occupied, for 50.1%.
- Denver's total population is 715,522.
- Denver Metro Area ranked 11th on Stessa's list of US cities with the most economic growth.
- Between 2009 and 2019, there was a 28% rise in jobs in the city, a 38% growth in GMP, and "a 24% increase in jobs at firms founded five or fewer years ago."
- The report by the Common Sense Institute notes that there is an affordable housing crisis in Denver. In May 2021, the number of home listings was record-low, with 2,075. The typical monthly average is 15,563.
- The same report mentions that one of the reasons is an insufficient number of new homes being built each year across the state of Colorado. Since 2008, it has been 46% below the national average.
- In 2020, Denver-Aurora-Lakewood Metro Area had 19,278 new housing units and 65.7 new units per 10,000 residents. 42.7% of units were multi-family. The area ranked 58th on the list of US metros with the largest investments in new housing.
Colorado Springs, CO
- There were about 2,429 hail loss claims in Colorado Springs in 2019, compared to 34,147 such claims in 2018 and around 8,000 claims in 2020.
- The city had 38,044 such claims between 2017 and 2019, which places it third on the list of cities with the highest number of hail loss claims. Between 2018 and 2020, it ranked first, with around 47,000 claims.
- The average household income is $84,708, while the median household income is $64,712.
- 59% of housing units are owner-occupied, while 41% are renter-occupied.
- The city's total population is 478,961.
- GDP in Colorado Springs Metro Area went from $30 billion in 2015 to $40 billion in 2021.
- Industries such as military, health care, construction, professional, and technical services all registered double-digit growth in the city between 2016 and 2020.
- In 2020, the Regional Building Department issued 4,500 single-home building permits, the highest number since a 2005 record of 5,314.
- In the same year, Colorado Springs ranked 43rd on the list of metro areas investing the most in new housing. It had 74.5 new units per 10,000 residents and 5,508 new housing units. 26.5% of new units are multi-family.

McKinney, TX
- McKinney had 8,143 hail loss claims in 2019 and 34,134 between 2017 and 2019.
- The average household income is $113,806, while the median household income is $93,354.
- Owner-occupied housing units account for 65.8% of all units, while renter-occupied account for 34.2%.
- The city's total population is 199,177.
- McKinney has been included as one of the ten fastest-growing US cities in terms of economic growth by Wallethub in 2018.
- The most recent job growth rate is 5.6%.
- In 2019, US Census named it the sixth fastest-growing city in the US.
- In 2020, there were 1,548 new construction permits for single-family and single attached family homes. As of July 2021, there were 991 active permits since the beginning of the year.
- As noted above, Dallas - Fort Worth - Arlington Metro Area ranked 33rd on the list of metropolitan areas that invest the most in new housing, with 62,563 new housing units, 83 new housing units per 10,000 residents, and 43.8% of new housing units being multi-family.
Dallas, TX
- Dallas had 10,874 hail loss claims in 2019, compared to around 4,000 in 2020.
- Between 2017 and 2019, there were 25,262 hail loss claims in the city.
- The average household income in Dallas is $86,393, while the median household income is $52,580.
- 40.9% of housing units are owner-occupied, while 59.1% are renter-occupied.
- The city's total population is 1,343,573.
- Dallas-Fort Worth-Arlington was chosen as the top labor market in the country due to factors such as job gain, job growth, and wage growth. These factors also indicate strong economic growth.
- Employment in the city has grown by 8.45% between 2020 and 2021, while the median household income has increased by 6%.
- GDP for the metro area went from 478 billion in 2017 to 524 billion in 2019.
- New construction permits in Dallas Metro Area have increased by 41% between 2020 and 2021, including a 39% growth for single-family homes and a 41% increase for multifamily construction. It is the most relevant statistic available related to the number of new homes being built or the aggregate growth rate of new construction.
- Dallas - Fort Worth - Arlington Metro Area ranked 33rd on the list of metropolitan areas that invest the most in new housing, with 62,563 new housing units, 83 new housing units per 10,000 residents, and 43.8% of new housing units being multi-family.
Frisco, TX
- In 2019, in Frisco, there were 6,615 hail loss claims. The city totaled 23,874 hail loss claims between 2017 and 2019.
- The average household income in Frisco is $153,704, while the median household income is $127,055.
- 71.6% of the housing units are owner-occupied, while 28.4% are renter-occupied.
- The city's total population is 200,490.
- In 2019, Frisco ranked first among midsized cities on WalletHub's list of cities with the highest job growth.
- Frisco is considered the fastest-growing city in Texas and one of the fastest-growing in the US, both in terms of economy and population.
- In 2020, Frisco issued 2,445 residential permits, more than any other city in North Texas. However, this year, it has lost the lead to a much smaller city, Celina (with 1,283 permits versus 1,352).
- As noted above, Dallas - Fort Worth - Arlington Metro Area ranked 33rd on the list of metropolitan areas that invest the most in new housing, with 62,563 new housing units, 83 new housing units per 10,000 residents, and 43.8% of new housing units being multi-family.
Greeley, CO
- There were around 2,298 hail loss claims in Greeley in 2019, compared to 18,576 in 2020. Between 2017 and 2019, the city had 23,556 hail loss claims.
- The average household income is $72,302, while the median household income is $57,586.
- 59.6% of housing units are owner-occupied, while 40.4% are renter-occupied.
- The total population of Greeley is 108,795.
- Employment in the city has grown by 8.45% between 2020 and 2021, while the median household income has grown by 4.69%.
- However, according to the US Bureau of Economic Analysis, while Greeley's GDP grew significantly between 2016 and 2018, it decreased from 20.3 billion in 2018 to 19.9 billion in 2019.
- Greeley Metro Area ranked 10th on the list of US metro areas investing the most in new housing. In 2020, it had 3,897 new housing units and 124 new units per 10,000 residents. 25.4% of new units were multi-family.
Lakewood, CO
- There were 630 hail loss claims in Lakewood in 2019. The total number of claims between 2017 and 2019 was 22,105, mainly due to 18,986 claims in 2017.
- The average household income is $88,244, while the median household income is $66,740,
- 58.3% of housing units are owner-occupied, while 41.7% are renter-occupied.
- The total population of Lakewood is 157,935.
- Since reliable data on the economic growth in Lakewood alone is not available, we provided information for the metro area instead. Denver-Aurora-Lakewood Metro Area recorded a 22% increase in median earnings between 2009 and 2019, which is the third-largest increase among large metropolitan areas.
- GDP for the metro area went from 137 billion in 2009 to 227 billion in 2019, growing steadily each year.
- As noted above, in 2020, Denver-Aurora-Lakewood Metro Area had 19,278 new housing units and 65.7 new units per 10,000 residents. 42.7% of units were multi-family. The area ranked 58th on the list of US metros with the largest investments in new housing.
Lubbock, TX
- In 2019, the city had 8,631 hail loss claims, compared to about 12,000 such claims in 2020.
- Between 2017 and 2019, there were 21,756 hail loss claims in total.
- The average household income is $71,273, while the median household income is $50,453,
- 51.2% of housing units are owner-occupied, while 48.8% are renter-occupied.
- Total city population is 258,862.
- The latest metrics of economic growth are slightly older than 24 months. As of October 2019, Lubbock's job growth for the previous year was 0.6%, forecast job growth was 1.3%, while the median household income growth was at 1.5%.
- Lubbock Metro Area ranked 52nd on the list of metro areas that invest the most in new housing, with 2,253 new housing units, 70.6 new units per 10,000 residents, and 33.1% of new units being multi-family.
Odessa, TX
- Odessa had 1,116 hail loss claims in 2019. The total number of such claims for 2017-2019 was 19,812, mainly due to 18,467 claims in 2017.
- The average household income is $84,817, while the median household income is $63,847.
- 59.7% of housing units are owner-occupied, while 40.3% are renter-occupied.
- The city's total population is 123,334.
- According to the US Bureau of Economic Analysis, Odessa's GDP went from 12.4 billion in 2018 to 12.7 billion in 2019. The growth between 2018 and 2019 was less dynamic than in previous years.
- A previously mentioned Forbes ranking from October 2019 puts Odessa's 2018 job growth at 9.6%, projected growth at 1.4%, and household income growth at 0.4%.
- Odessa Metro Area ranked 19th on the list of metro areas with the largest investments in new housing. There were 1,782 new housing units and 109.9 new units per 10,000 residents. The share of multi-family units was 58.3%.
San Antonio, TX
- There were approximately 16,000 hail loss claims in 2020. Between 2018 and 2020, there were around 27,000 hail loss claims.
- It is worth noting that San Antonio experienced the most significant growth in hail loss claims, with a 457% increase from the previous period.
- The average household income in San Antonio is $70,778, while the median household income is $52,455.
- 53.9% of households are owner-occupied, while 46.1% are renter-occupied.
- The city's total population is 1,547,253.
- According to the most recent San Antonio Economic Indicators by Dallas Fed, the business-cycle index ("a broad measure of economic activity in the metro) grew by 7.4% in September 2021, after a slight decline of 0.2% in August.
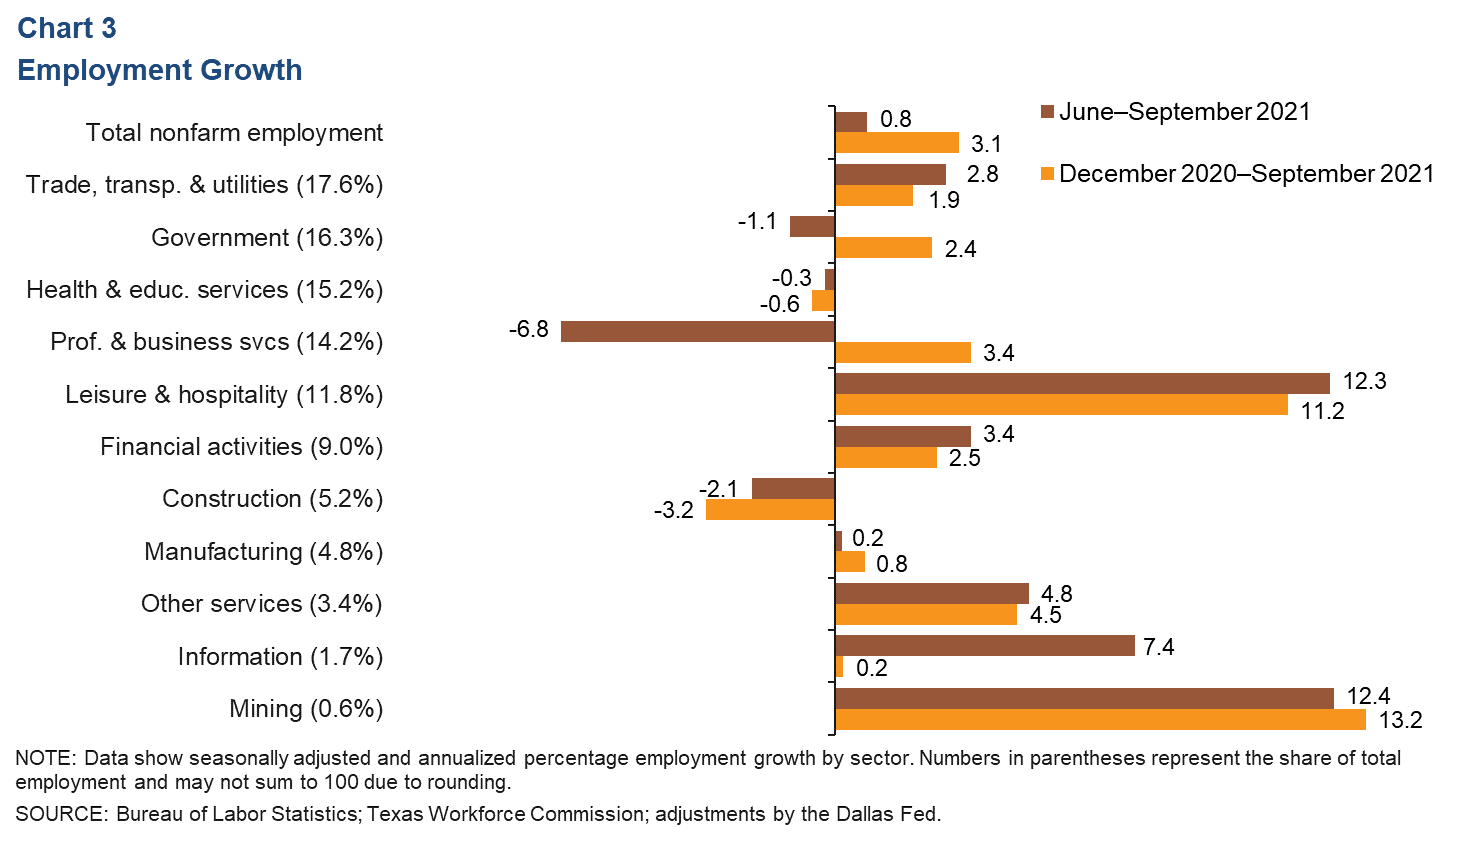
- Total nonfarm employment growth between December 2020 and September 2021 was 3.1%. Employment growth by sector has been illustrated on the chart below.
- Consumer spending in Bexar County has mostly recovered after the pandemic. It has grown by 10.9% compared to January 2020.
- San Antonio-New Braunfels Metro Area ranked 63rd on the list of metro areas with the largest investments in new housing, with 15,919 new housing units out of which 42.7% were multi-family, and 63.2 new units per 100 residents.
Fort Worth, TX
- In 2020, there were approximately 10,000 hail loss claims in the city. Between 2018 and 2020, Fort Worth had around 22,000 hail loss claims.
- The average household income is $82,977, while the median household income is $62,187.
- 57.4% of the housing units are owner-occupied, while 62.6% are renter-occupied.
- The city's total population is 909,585.
- According to a paper published on November 3, 2021, Fort Worth's economy has been recovering from the pandemic with steady job growth, improving business-cycle index, and record nominal wages. The paper provides figures from August 2021 to demonstrate the recovery. In that month, the business-cycle index grew by 8.5%, the city added 10,700 jobs, and nominal wages grew by 3%.
- Fort Worth's Economic Development Strategic Plan claims that it is one of the fastest-growing large cities in the US due to employers such as Lockheed Martin and American Airlines and strategic investments in district development that have been attracting private investors and fostered employment growth.
- As noted above, Dallas-Fort Worth-Arlington Metro Area ranked 33rd on the list of metropolitan areas that invest the most in new housing, with 62,563 new housing units, 83 new housing units per 10,000 residents, and 43.8% of new housing units being multi-family.
- Furthermore, in 2020, the city of Fort Worth issued 13,920 residential building permits, compared to 11,523 permits in 2019 and 11,687 permits in 2018. According to the report on the city's economic perspectives, single-family residential development is set to continue growing as a response to dynamic population growth.
Rapid City, SD
- Rapid City had around 13,000 hail loss claims in 2020. There were about 21,000 such claims between 2018 and 2020.
- The average household income is $73,679, while the median income is $52,351.
- 61.8% of housing units are owner-occupied, while 38.2% are renter-occupied.
- The city's total population is 77,503.
- Rapid City's GDP went from 4.8 billion in 2009 through 5.5 billion in 2017 to 5.7 billion in 2019.
- As of October 2019, household income growth was at 3%, job growth for the previous year was 1%, and projected job growth at 0.8%.
- Rapid City Metro Area ranked 112th on the list of US metro areas that invest the most in new housing. It had 658 new housing units, 38.1% of which were multi-family. There were 44.2 new units per 10,000 residents.
Houston, TX
- In 2020, there were about 7,000 hail loss claims in Houston. Also, the city had approximately 12,500 such claims between 2018 and 2020.
- The average household income is $84,179, while the median household income is $52,338.
- 42.3% of housing units are owner-occupied, while 57.7% are renter-occupied.
- Houston's total population is 2,320,268.
- Houston's current job growth rate is 4.5%. The city has recovered 67% of the jobs lost during the pandemic.
- The business-cycle index (a metric by Dallas Fed, defined above) grew by 8% in June-August 2021.
- As of October 2019, the household income growth was 2.9%.
- Houston-The Woodlands-Sugar Land Metro's GDP in 2019 was $512.2 billion, which makes it the seventh-largest metro in the US. To compare, 2017 GDP was $468.8 billion, while 2018 GDP was $498 billion.
- In 2020, there were 61,770 new housing units in Houston-The Woodlands-Sugar Land Metro Area, and 88.3 new units for 10,000 residents. 35.5% of new units were multi-family. The area ranked 29th on the list of US metro areas that invest the most in new housing.
Arlington, TX
- While Arlington is not on the list of cities with the highest number of hail loss claims, it is included in the 2021 publication by the National Insurance Claim Bureau as one of the cities with the highest number of questionable hail loss claims. Considering that almost all other cities are included on both lists, it can be assumed that Chicago is just below the top ten on the other lists.
- Specifically, Arlington had around 54 questionable hail loss claims between 2018 and 2020, approximately 14 of which were in 2020. It ranked fifth on the list of cities with the highest number of questionable hail loss claims, preceded by Colorado Springs, Denver, San Antonio, and Fort Worth.
- The average household income is $79,268, while the median household income is $60,571.
- 55.2% of housing units are owner-occupied, while 44.8% are renter-occupied.
- The total population is 398,854.
- Quantitative data on Arlington's economic growth specifically is not available. However, it is said to be "the nation’s fourth-largest labor supply, many of whom are graduates of the University of Texas at Arlington."
- In the Fort Worth-Arlington Metropolitan Fair Market Rent Area, median household income went from $65,800 in 2014 to $75,200 in 2018 and $81,500 in 2020.
- In August 2021, employment in Fort Worth-Arlington grew by 4.1% compared to the same time last year.
- As noted above, Dallas - Fort Worth - Arlington Metro Area ranked 33rd on the list of metropolitan areas that invest the most in new housing, with 62,563 new housing units, 83 new housing units per 10,000 residents, and 43.8% of new housing units being multi-family.
Chicago, IL
- Chicago is tied with Arlington on the list of US cities with the most questionable hail loss claims, which is why we applied the same logic to its inclusion on the list.
- Specifically, Chicago had around 54 questionable hail loss claims between 2018 and 2020, 30 of which were in 2020. The city ranked fifth on the list of cities with the highest number of questionable hail loss claims, preceeded by Colorado Springs, Denver, San Antonio, and Fort Worth.
- 45% of households are owner-occupied, while 55% are renter-occupied.
- The average household income is $90,713, while the median household income is $58,247.
- The total population is 2,746,388.
- Chicago's GDP was $619 billion in 2019, compared to $615 billion in 2018 and $602 billion in 2017.
- The metro area has recovered 41% of jobs lost during the pandemic. The full recovery is expected in 2024, after a 2.4% growth in 2021 and a 4.4% growth in 2022.
- Chicago's economic growth is fueled by a well-educated workforce from its top universities and the technological sector. However, it has been slowed down by its dependence on the manufacturing job base.
- Chicago Metro Area ranked 215th on the list of metros that invest the most in new housing with 18,021 new housing units, 19 new housing units per 10,000 residents, and 57.9% of new units being multi-family.

Research Strategy
As noted in job expectations, we based our list on data from the National Insurance Claim Bureau, using its publications from 2020 and 2021. The former provides data for 2017-2019, while the latter, for 2018-2020. However, when possible we used the earlier report and noted any additional data available in the publication from 2021. The earlier source includes more specific figures. The 2021 publication only provides a chart. For cities that are only included in the 2021 report, we read the data from the chart and noted that the figures are approximate. Since the total number of cities from both lists (with multiple being included on both) is 14, we also provided two cities from the ranking of cities with the highest number of questionable hail loss claims. Since most of the places included there were also featured on other lists, we assumed that it is an indicator of having a high overall number of hail loss claims and that both Chicago and Arlington are likely to be just below the top ten in terms of the total number of such claims. However, regional media, nonprofit organizations, reports on hail storms and hail loss claims in the US, and similar sources do not provide the number of hail storm claims in these cities, which is why this information was not provided.
We provided both the average and the median household income since only the latter was available in official government sources. Since the information on new houses being built or new construction rates was not available for cities specifically, we included information for metro areas. When available, we also presented data on new housing permits in the cities for additional context.
It was not possible to include the same metric of economic growth for each city. Based on data availability, we provided various indicators for different cities. For some of them, we used a 2019 ranking by Forbes, which uses data from October 2019. Still, it was the most recent and relevant data available. Also, the list itself is from December 2019. For some cities, like with the number of new housing units, we also provided data for metro areas, since publicly available city-level data is not specific enough. To verify this, we searched city economic development reports, local media sites, government databases, and academic papers.
As previously suggested, we had to use the percentage of owner-occupied housing units, as data for single-family homes was not available. We also couldn't find the number of hail-related property claims for the cities. However, for reference, 64% of hail loss claims in the US are in the "personal property - homeowners" category. More specific information was not available in regional media, reports by nonprofit organizations, local government websites, and similar.