Part
01
of one
Part
01
Americans Spending on Physical Therapy/Chiropractic Services/etc.
According to The Stress Institute, Americans spent an average of $11 billion a year on massage sessions. Their average frequency of visits to their massage therapists is around 114 million times per year. Meanwhile, IBISWorld reports that the massage services market size in the U.S. is around $16 billion in 2019. The rest of the available insights on spending in this sector were presented below.
Massage Spending
- According to The Stress Institute, Americans spent an average of $11 billion a year on massage. Their average frequency of visits to their massage therapists is around 114 million times per year. Since there was no mention of corporate entities involved, the amount could be mostly out-of-pocket expenses.
- According to IBISWorld, the massage services market size in the U.S. is around $16 billion in 2019.
- Based on the latest available report from the American Massage Therapy Association, around 19% of adult Americans avail of massage therapies. This translates to around 47.5 million Americans availing of 214 million massage sessions in a year.
- Based on a study, the average cost of a massage session in the U.S. is around $60 per hour.
- Assuming a one-hour typical session, the triangulated figure of the average spending on massage therapy was calculated as follows based on the figures above:
- Number of massages availed by Americans in a year: 214 million massage sessions
- Average cost of a one-hour session: $60
- Average spending of Americans on massage therapy in a year: $60 (214 million) = $12.84 billion.
Physical Therapy Spending
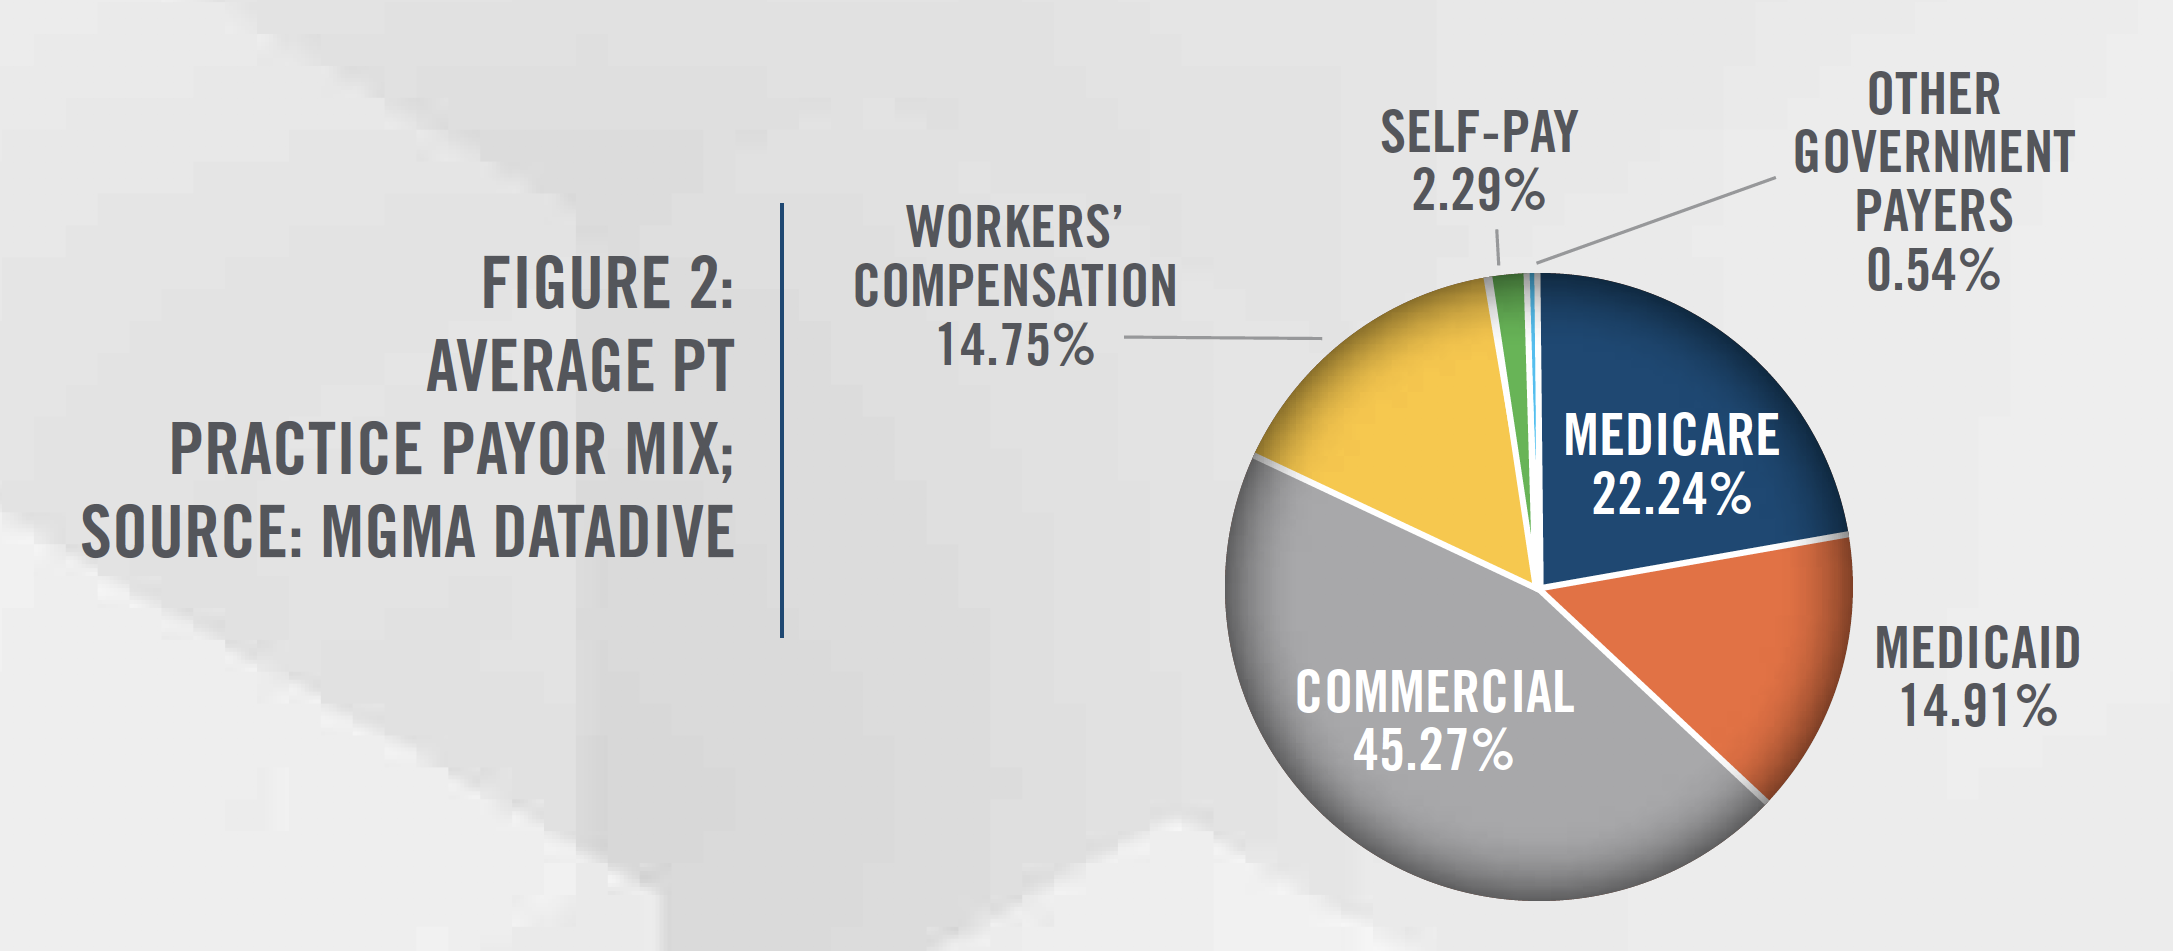
- According to the latest available report from Market Research, the physical therapy market size is around $34.5 billion. As this value was based on the payment receipts of patients who are availing of physical therapy services, this figure can represent the amount spent by Americans on physical therapy services in a year.
- Those who self-pay constitute 2.29% of the payors in this market as seen in the figure below.
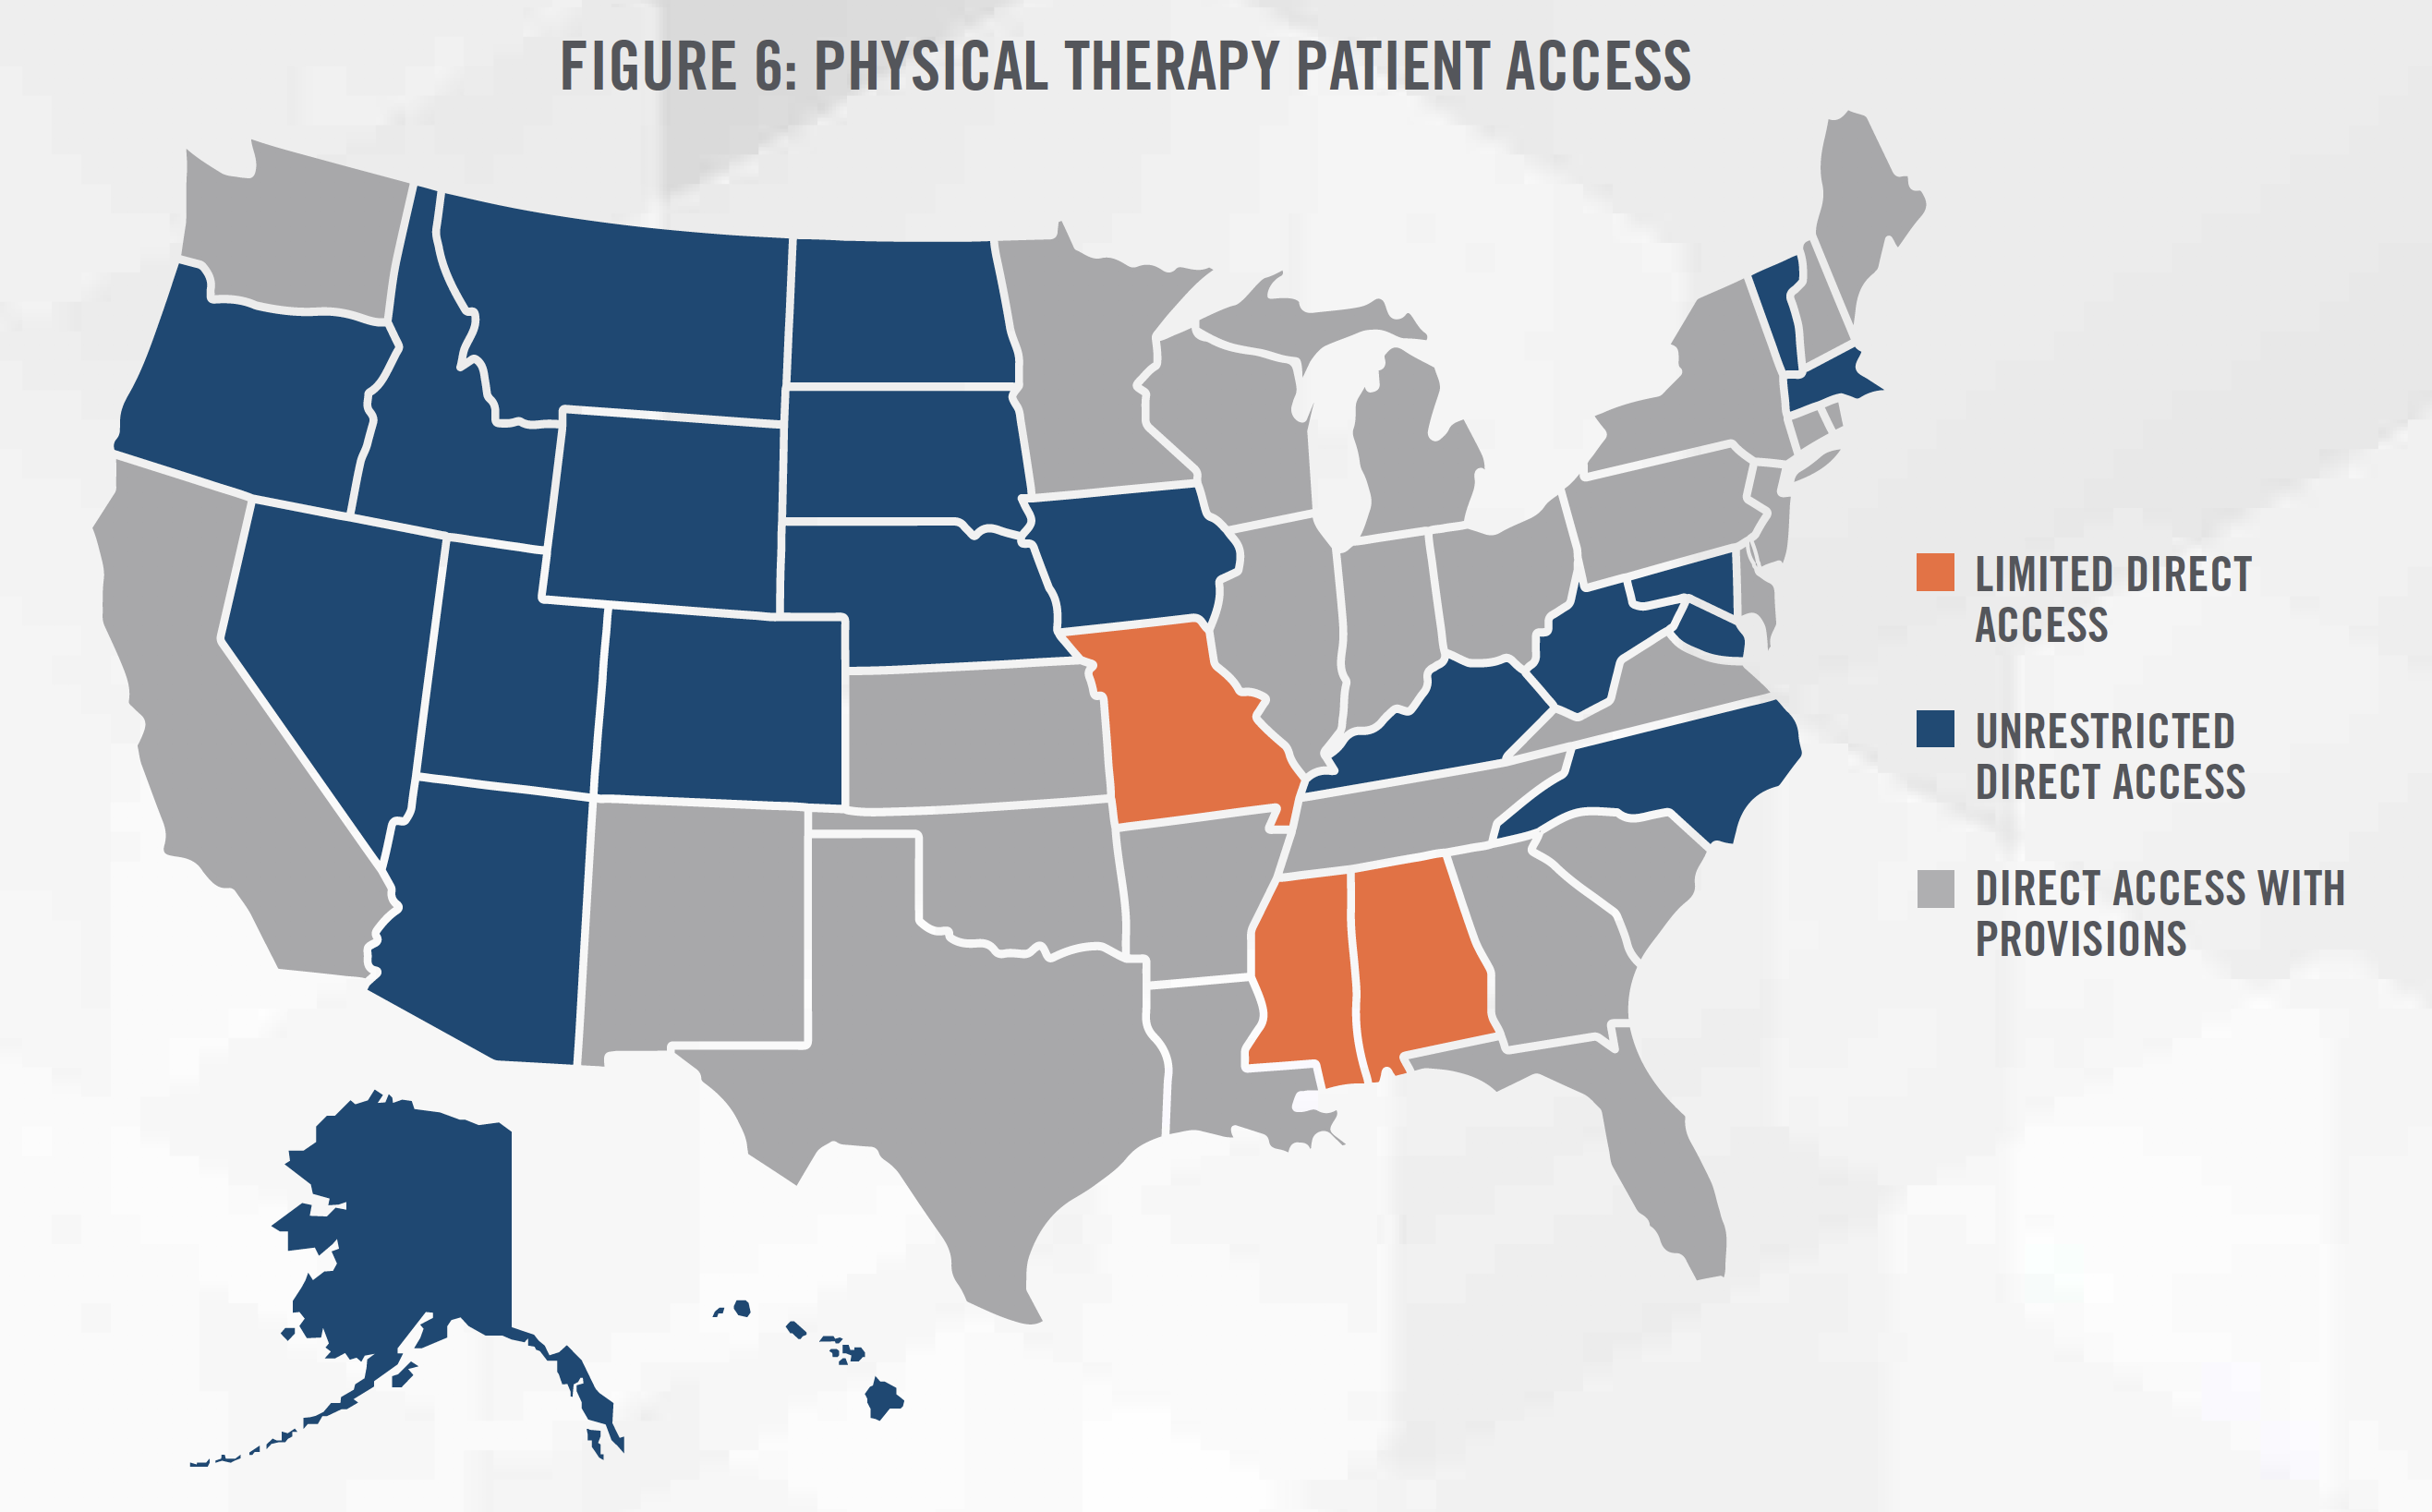
- Based on the APTA survey, only around 50% mentioned that they have direct access to physical therapists.
- As shown below, only those states with no direct access restrictions exhibited increased usage of direct physical therapist access at 65.5%.
Chiropractic Services Spending
- Around 35 million Americans avail themselves of chiropractic services every year.
- Around one million "chiropractic adjustments" are done daily in the U.S.
- Based on the latest report from Research and Markets, the U.S. chiropractic market size is projected to be worth $17.93 billion in 2025 at a compounded annual growth rate (CAGR) of 4.32% from 2018 to 2025. Based on the calculations below, the estimated market size in 2020 of this sector was around $14.38 billion.
- 2025 Value = $17.93 billion
- 2024 Value = $17.93 billion - ($17.93 billion*4.32%) = $17.16 billion
- 2023 Value = $17.16 billion - ($17.16 billion*4.32%) = $16.42 billion
- 2022 Value = $16.42 billion - ($16.42 billion*4.32%) = $15.71 billion
- 2021 Value = $15.71 billion - ($15.71 billion*4.32%) = $15.03 billion
- 2020 Value = $15.03 billion - ($15.03 billion*4.32%) = $14.38 billion
- Americans spend around $30 to several hundred dollars on chiropractor services per session.
Additional Data:
- Based on a survey by Harris Poll on behalf of the "ATI Physical Therapy (ATI)" association, around 42% of Americans would "feel uncomfortable" with an out-of-pocket payment for services such as physical therapy to ease their pain from conditions such as chronic musculoskeletal (MSK) ailments.
Research Strategy
To determine the amount spent by Americans on physical therapy, chiropractic services, massage, and other related wellness services each year, we looked through various industry publications such as those from the American Massage Therapist Association and other related sources. We also searched media sites such as Forbes, CNBC, and other similar sites. Based on this search approach, we were able to get some statistics on the annual spending on these services. However, the data points we got were not specific and comprehensive and there was no solid information on out-of-pocket expenses. Given that there was no corporate spending mentioned on the reports, we assumed that the figures were mostly out-of-pocket expenses. For some services, there was no mention of specific spending figures in the various reports we looked at.
We then consulted market research reports such as those from Markets and Markets, Research Market, IBISWorld, and other similar sources. We then obtained the market sizes of these services in the U.S. Based on the explanations in the reports, the market sizes were derived from consumer spending on these services. We then inferred that the market sizes we got already correspond to the annual spending made by Americans on these services. There were also some differences in the figures mentioned in various reports. These variations could be due to the methodology used by the various studies on these sectors. For some services such as chiropractic services, the spending data also have some huge variability due to the wide range of the amount paid by Americans for specific types of sessions.
Based on these findings, we presented the available statistics we found that closely approximate the figures spent by Americans on these services. We also included some helpful insights and statistics to further describe the available figures.